


Released March 19, 2020, by the National Agricultural Statistics Service (NASS), Agricultural Statistics Board, United States Department of Agriculture (USDA)
Special Note
Honey price per pound data have been updated to dollars per pound from cents per pound. Before deciding to update this data, NASS reviewed our estimating programs against mission- and user-based criteria requirements to maintain the strongest data in service to U.S. agriculture. Information about all NASS surveys and reports is available online at www.nass.usda.gov.
United States Honey Production Up 2 Percent in 2019
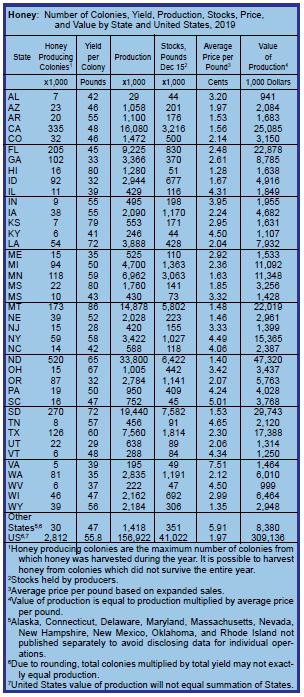
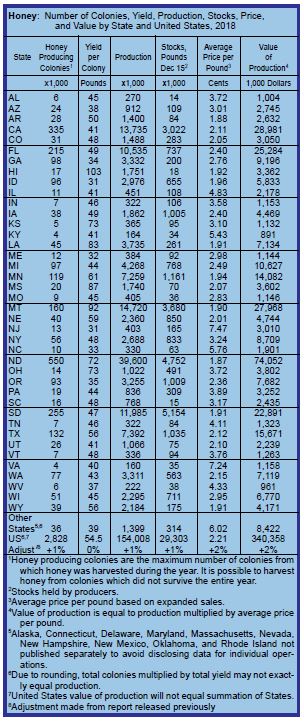
United States honey production in 2019 totaled 157 million pounds, up 2 percent from 2018. There were 2.81 million colonies producing honey in 2019, down 1 percent from 2018. Yield per colony averaged 55.8 pounds, up 2 percent from the 54.5 pounds in 2018. Colonies which produced honey in more than one State were counted in each State where the honey was produced. Therefore, at the United States level yield per colony may be understated, but total production would not be impacted. Colonies were not included if honey was not harvested. Producer honey stocks were 41.0 million pounds on December 15, 2019, up 40 percent from a year earlier. Stocks held by producers exclude those held under the commodity loan program.
Honey Prices Down 11 Percent in 2019
United States honey prices decreased 11 percent during 2019 to $1.97 per pound, compared to $2.21 per pound in 2018. United States and State level prices reflect the portions of honey sold through cooperatives, private, and retail channels. Prices for each color class are derived by weighting the quantities sold for each marketing channel. Prices for the 2018 crop reflect honey sold in 2018 and 2019. Some 2018 crop honey was sold in 2019, which caused some revisions to the 2018 crop prices.
Price Paid per Queen was 18 Dollars in 2019
The average prices paid in 2019 for honey bee queens, packages, and nucs were $18, $85, and $100 respectively. Pollination income for 2019 was $310 million, up 3 percent from 2018. Other income from honey bees in 2019 was $77.7 million, down 18 percent from 2018.
One thing we would like you to note is that this year we have provided the updated 2018 Honey Report for two reasons. First, NASS always has updated data provided by beekeepers, packers, importers, exporters and the like as some data wasn’t collected due to be in transit, under or over reported initially, or other reasons. For this reason, when the next report is due out, the unreported or corrected data is added to the previous report so the historical data is then correct. We note this as there are changes in last years data that bear noting. Recall that the report last year was delayed due to the government shut down and wasn’t released until May instead of the traditional March release. Some confusion and reporting errors resulted. We wanted to make sure the you are aware of these corrections, and that you can now see what your state, and the whole of the industry did last year. Some states had significant changes, many hardly any, but the two columns to note for certain are the Average price per pound, and the value of production. This is how the 11% drop in average price per pound between 2018 and 2019 showed up. 11% is a significant drop in just one year, and one that will affect markets next season when it comes to honey production decisions.`
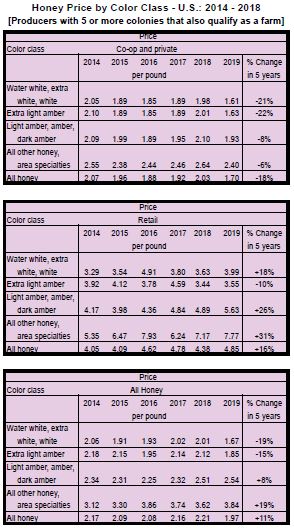
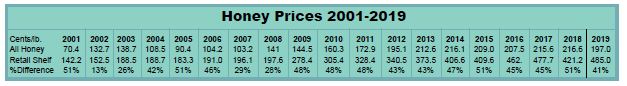
USDA Honey Prices by color class 2014 – 1019
Look closely at the prices by where honey is sold over the past five years. From the 5,000 foot view, retail seems to be doing well, while co-op over all color classes averages a 15% drop, with water-white and extra light amber down over 20%, and all honey prices are down 11%.
But consider again retail prices, up 16% overall, and then review the amount of imported honey sold, last year making up 68% of all honey sold in the U.S. in 2019. The difference in wholesale price of imported honey, with some selling for as little as less that $1/lb, and retailing, overall, for almost $5/lb. What’s wrong with this picture?
Per Capita Honey Consumption, 2019
This figure is arrived at each year, using data from USDA NASS, USDA ERS, the FARM SERVICE AGENCY, and the US CENSUS BUREAU. From these sources we calculate the amount of honey that was produced in the U.S. during 2019, how much was imported from off shore, what stocks were left over from the previous year, and how much of the 2019 crop was put under loan, and, though rarely, how much was on loan from the previous year.
Once we have that figure, which we call “Honey In” we calculate how much of this was used somewhere besides the U.S. Exports play into this certainly, how much honey beekeepers and packers have sitting in their warehouses, and how much beekeepers put under loan for this year’s crop. This figure is what we call “Honey Out”.
If we subtract the Honey Out figure from the Honey In figure, what’s left is what was consumed during the year. It’s the same formula we use every year, and we gather our data from the same sources every year. There are some caveats you should be aware of every year though. The USDA makes a similar analysis every year on a wide variety of commodities using somewhat more sophisticated resources than we have available. After all, they are the Federal Government. But we won’t hold that against them. What they are able to do is look at things like honey purchased but not consumed, the waste that occurs (ever know anybody that throws away a jar of crystalized honey because it went bad?), export and import shipments that are between here and there when the count is taken.
Our argument is that our numbers are pretty straight forward in that we gather everything we can, the same way every year and make the same calculations every year. We strongly believe that, like our monthly honey report, if our numbers aren’t exact spot on, the trends you see here over the months and years are as good as, if not better than the exact numbers of other reports. So, look at the patterns of honey in and honey out and amounts put under loan and imports each year to see a bigger story than just how much.
Figures this year for HONEY IN:
U.S. beekeepers, with more than five colonies, produced this year 156.9 million pounds of honey. Right off you can see that the final figure is going to be a little less than it should be because none of the honey produced by backyard beekeepers – those with fewer than five colonies – gets counted. That includes a lot of Farm Market honey, back door and sold at work honey, and honey consumed at home. And, of course, you realize that not every single person in this country eats as much honey as the figures say they do, so take some, give some, the numbers are what they are, but at least they are consistent. In 2018 US producers with more than five colonies made 154.0 million pounds, which comes to an increase in 2019 of 2.9 million pounds, and with 14,000 fewer colonies in 2019 than 2018. Then add in the stocks of honey produced in 2018 carried into 2019, which came to 29.3 million pounds, plus honey under loan from 2018 that came out for sale of 7.4 million pounds. One last input here, imports during 2019 came to 416.3 million pounds (compared to 442.6 million pounds in 2018, a 6% drop), which we’ll look at in a bit. So total “Honey In” during 2019 came to 156.9 million + 29.3 million + 7.4 million + 416.3 million pounds for a total of 609.9 million pounds of Honey In in 2019 (about 15 million pounds more this year than last).
Figures this year for HONEY OUT:
U.S. sellers exported 4.2 million pounds of honey to various countries this past year continuing a downward trend (compared to 9.7 million pounds in 2018), and put 9.8 million pounds under loan, plus another 41 million pounds are still unsold so are sitting in producers or packers warehouses (compared to 29.1 million pounds in 2018). This comes to 70 million pounds of honey produced but not consumed last year, up from the 46 million pounds last year.
Now, total consumption is calculated by taking all the honey in, subtracting all the honey out, resulting in the amount of honey consumed during the year.
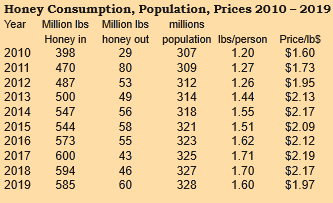
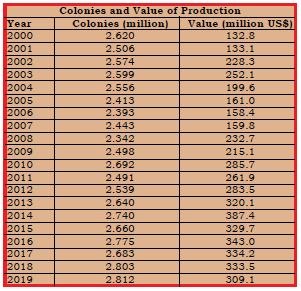
Honey In = 609.9 million pounds (up 35% in a decade)
Honey out = 55 million pounds
Total consumption then = 609.9 million – 55 million = 554 million pounds consumed
U.S. population on July 1, 2019 = 328.7 million people (up 21 million, or 7% in a decade). We use the July 1 population each year for consistency.
Per Capita consumption = 554 million pounds divided by 328 million people = 1.69 pounds of honey consumed by each person in the US during 2019, which is, actually, a 30% increase in a decade). This is 27.2 ounces per person, which was the same amount per person as last year. No gain, but, no loss either.
Now, look at this another way. We consumed 609.9 million pounds last year. Of that, 193.6 million pounds were produced, in either 2019 or 2018, in the US. This means imports amounted to 68% of the honey consumed in the US in 2019. This is actually down from the 75% of honey consumed in the US in 2018, which is a pleasant turn of events.
Some of this may be due to the price of US honey, as an overall average figure by USDA that is only $1.97, dropping significantly from the 2018 price of $2.17. That’s a $0.20/lb drop, which adds up when you look at the 156 million pounds produced last year. Actually it adds up to about $31.2 million less income for U.S. beekeepers in 2019.
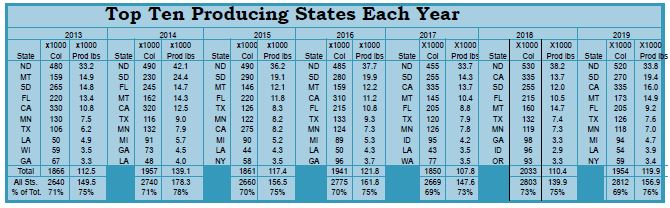
The top 10 honey producing states don’t change much year to year, but they do change some, especially the bottom five or so. Almost every year North and South Dakota lead the pack, and this year is no exception, with just those two states producing over 18% of the whole U.S. honey crop, and SD almost 10% of the U.S. crop. Combined, these 10 ammounted to more than a quarter of the U.S. crop last year.
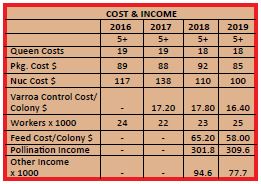
Having a four-year picture of these elements of doing business gives a better picture of the game we all play. Package and nuc costs are interesting, as is the labor picture. The most telling number, however, is the ‘Other Income’ numbers, down almost $17 million for U.S. beekeepers this past year.
All told, the top ten housed 69% of all the colonies in the US last year, and produced 76% of all the honey produced in the U.S. last year. Oregon made the list for the first time in the last eight years this time, and New York only the second time in the last eight. The rain in California last season spiked honey production there, producing the biggest crop, and having the most colonies in the last seven years. This year, 2020 will be interesting with good moisture again this Spring.
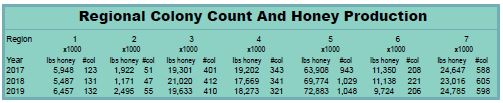
We provide a three-year picture of colonies and honey production by region for the first time to show how they stack up, and how consistent they are, or aren’t.
Just for comparison’s sake, here are year to year prices paid for domestic and imported honey according to USDA AMS National Honey Report, released March 27, 2020
Honey Market For The Month Of FEBRUARY 2020 In Volumes Of 10,000 Pounds Or Greater Unless Otherwise Stated. Prices paid to beekeepers for extracted, unprocessed honey in major producing states by packers, handlers & other large users, cents per pound, f.o.b. or delivered nearby, containers exchanged or returned, prompt delivery & payment unless otherwise stated. Report includes both new and old crop honey – (#Some in Small Lot – +Some delayed payments or previous commitment)
CALIFORNIA
Buckwheat Amber $1.60
Mixed Flower Amber $1.60
Valley Amber $1.60
DAKOTAS
Canola White $1.55
Clover White $1.45 – $1.70
Clover Extra Light Amber $1.45
Clover Light Amber $1.45
Sunflower Extra Light Amber $1.55
FLORIDA
Brazilian Pepper Light Amber $1.60
Brazilian Pepper Amber $1.60
MARYLAND
Mixed Flower Extra Light Amber $1.52
MINNESOTA
Basswood Light Amber $1.72
MONTANA
Clover White $1.55
Mixed Flower Extra Light Amber $1.55
NEBRASKA
Clover White $1.45 – $1.55
Clover Extra Light Amber $1.45
TEXAS
Clover White $1.65
Prices paid to importers for bulk honey, duty paid, containers included, cents per pound, ex-dock or point of entry unless otherwise stated.
ARGENTINA
Clover White $1.13 – $1.17
Mixed Flowers White $1.13 – $1.22
Mixed Flowers Extra Light $1.10 – $1.22
Mixed Flowers Light Amber $1.11 – $1.18
BRAZIL ORGANIC Extra Light $.95
ORGANIC Light Amber $.95 – $1.02
Orange Extra Light $1.79
Mixed Flower Light Amber $.82 – $.85
Mixed Flower Amber $.84
INDIA
Mixed Flower White $.78
Mixed Flower Extra Light $.77 – $.79
Mixed Flower Light Amber $.76 – $.84
Mustard Extra Light $.83 – .89
Mustard Light Amber $.83
Mustard Amber $.78
UKRAINE
Sunflower White $.95 – $.97
Sunflower Extra Light $.84 – $.97
URUGUAY
Mixed Flower Light Amber $.81
Mixed Flower Amber $.81
VIETNAM
Mixed Flower Light Amber $.74 – $.80
Mixed Flower Amber $.63 – $.68
Honey Market For The Month Of JANUARY 2019 In Volumes Of 10,000 Pounds Or Greater Unless Otherwise Stated. Prices paid to beekeepers for extracted, unprocessed honey in major producing states by packers, handlers & other large users, cents per pound, f.o.b. or delivered nearby, containers exchanged or returned, prompt delivery & payment unless otherwise stated. Report includes both new and old crop honey – (#Some in Small Lot – +Some delayed payments or previous commitment)
DAKOTAS
Canola White $1.83
Clover White $1.83 – $2.15
Clover Extra Light Amber $1.80 – $2.05
Clover Light Amber $1.93 – $2.00
Mixed Flower White $1.83
Sunflower Extra Light Amber $1.80
Sunflower Light Amber $1.75
FLORIDA
Mixed Flower Extra Light Amber $1.70
Pepper Light Amber $1.55 – $1.65
GEORGIA
Pepper Light Amber $1.65
MINNESOTA
Clover White $1.95
Clover Extra Light Amber $1.95
MISSISSIPPI Soybean Amber $1.80
NEW YORK
Basswood Extra Light Amber $2.35
TEXAS
Cotton Light Amber $2.05
Prices paid to Canadian Beekeepers for unprocessed, bulk honey by packers and importers in U.S. currency, f.o.b. shipping point, containers included unless otherwise stated. Duty and crossing charges extra. Cents per pound. Clover White $1.36 Mixed Flower White $1.37 – $1.39
Prices paid to importers for bulk honey, duty paid, containers included, cents per pound, ex-dock or point of entry unless otherwise stated.
ARGENTINA
Clover White $1.30
Clover Light Amber $1.04 – $1.05
Mixed Flowers White $1.10 – $1.21
Mixed Flowers Extra Light $1.10 – $1.21
Mixed Flowers Light Amber $.99 – $1.20
BRAZIL
ORGANIC Extra Light $1.35
ORGANIC Light Amber $1.25 – $1.39
ORGANIC Amber $1.25
INDIA
Mixed Flower Extra Light $.86 – $.95
Mixed Flower Light Amber $.87 – $.93
Mustard Extra Light $.90
Mustard Light Amber $.90
MEXICO
Orange Blossom Extra Light $2.15
UKRAINE
Mixed Flower White $1.03
Sunflower White $.93
Sunflower Extra Amber $.93
URUGUAY
Mixed Flower Light Amber $.93
VIETNAM
Mixed Flowers Light Amber $.81 – $.90
Mixed Flowers Amber $.68