Real Time Watching Winter Clusters
By: Wyatt Mangum
That was for the Summer. This article extends the diagnostic capabilities of thermal cameras into Winter. First let’s examine two strong colonies wintering well. Then we will examine two Winter clusters under distress.
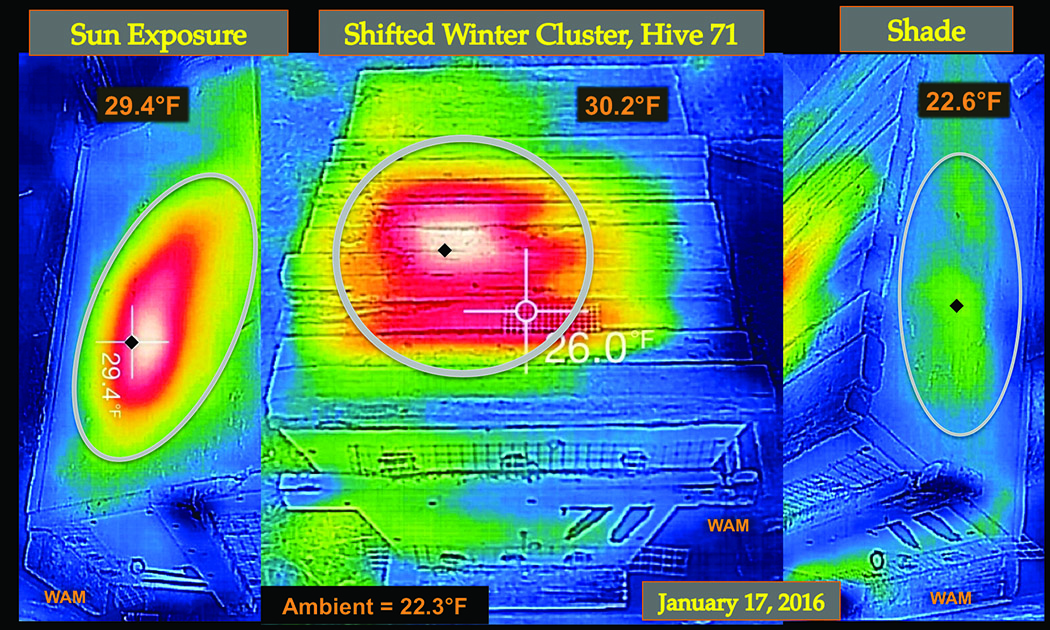
Figure 1.
With this innovative thermal technology, I wanted an efficient graphical way to show the heat from a Winter cluster in one picture. Figure 1 shows a Winter cluster radiating heat from the top and sides of top-bar hive 71, all in one composite heat signature, originally built from three separate heat signatures, which we can just call panels. The middle panel of the composite shows the top of the hive, seen from above and shifted towards the entrance end. The heat from the cluster conducts through the top bars where the color white is the hottest, followed by red, yellow, and blue the coolest. The side panels match the original sides of the hive. I aligned the side panels so the heat from all three would be in a row as with reality. The ovals emphasize the position of the cluster’s heat, which had shifted to the left. That shift was towards the warmer side of the apiary, sun exposed from dawn until afternoon.
The temperatures in the black boxes near the top of each panel are the temperatures at the black diamonds directly below them. (The camera recorded the temperature at the white crosshairs at the center of the image.) The heat losses from the top and warm-side of the cluster are nearly the same (30.2˚F, -1˚C, and 29.4˚F, -1.4˚C, respectively). Those temperatures are warmer relative to the cold side of the hive (22.6˚F,-5.2˚C). The composite heat signature shows an important fact when using a thermal camera. When a Winter cluster shifts in a hive, the colony may appear dead from the cold side of the hive. Therefore examine both sides of the top-bar hive. Moreover, the beekeeper should know the warm and cold sides of the apiary from how the sun arcs over it, and how much sunlight actually hits the hives because of shade. (If the sun exposure is not so pronounced, some clusters may shift towards the sun exposure while others do not.)
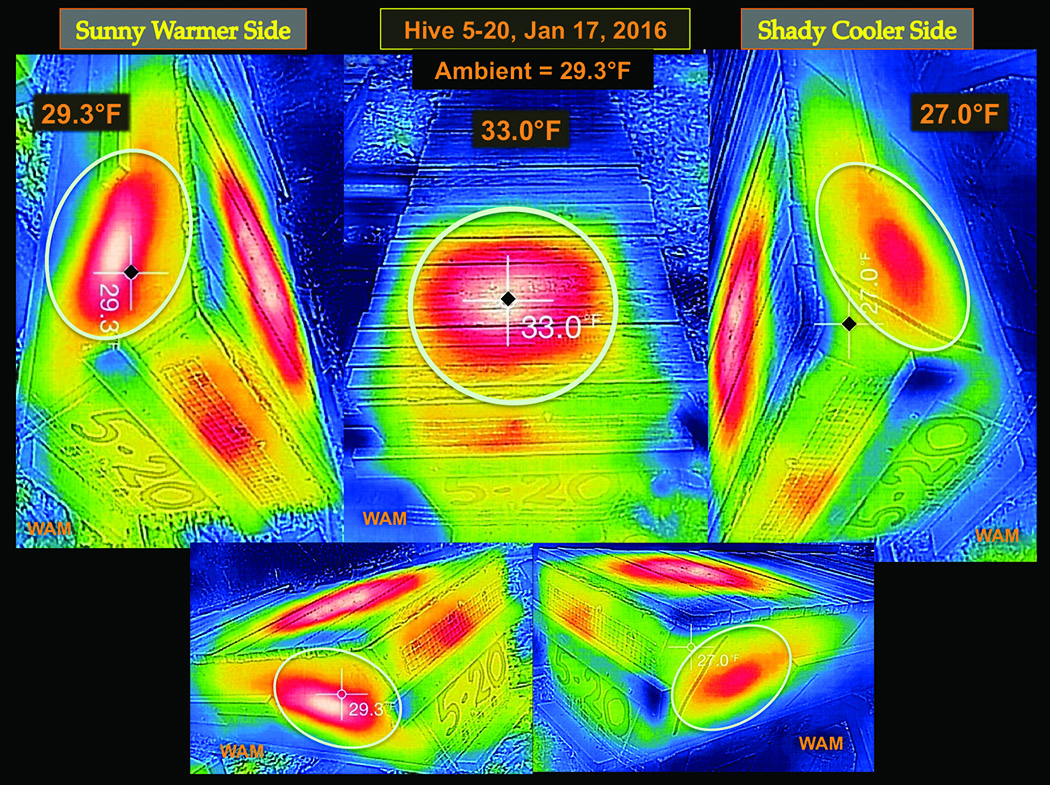
Figure 2.
Figure 2 shows a composite heat signature for hive 5-20 (5 means the hive is five-feet long). The three upper panels follow the format of Figure 1. The slight cluster shift to the left may not be apparent from only the top panel. The inscribed oval on the top panel helps to accentuate the shift, but the sides give better evidence. In this graphic, I added the two lower panels in a closer comparison of the sides. The sides show a warmer heat signature on the left. The left oval had a warmer white core compared to the cooler, all red, heat signature within the oval on the right. Apparently a slight shift to the warmer, afternoon side of the hive had occurred, a subtler cluster displacement than that of Figure 1.
In my old top-bar beekeeping, I conducted my Fall management analogous to frame hive beekeepers. Then mostly, I just left my colonies alone until Spring. Waiting to see the survival results. Waiting. No more of that. No more waiting. Now I go through the Winter with my bees. I go out, even on cold nights “watching” my Winter clusters. That’s my new top-bar hive beekeeping in the Winter. This Winter began generally warm, the temperatures more typical later on. My colony loss was low (about 11%), and most all heat signatures did not show signs of problems. Still, I suspected some difficulty might happen to the next colony. The thermal camera helped document some of what occurred in the cold. Before this camera, I would have found the final result later in the Spring.
“The thermal camera changed my Winter and early Spring
beekeeping from passive waiting to a more active watching.”
Under my Winter conditions, most large top-bar hive Winter clusters move up the combs slowly into the honey stored above the bees (called the honey bands). From its heat signatures, the next cluster began low on the brood combs. Later on, I found it high up on the combs in the former honey bands. The cluster’s heat signature seemed to be getting smaller too, suggesting the bees had an abnormally high death rate.
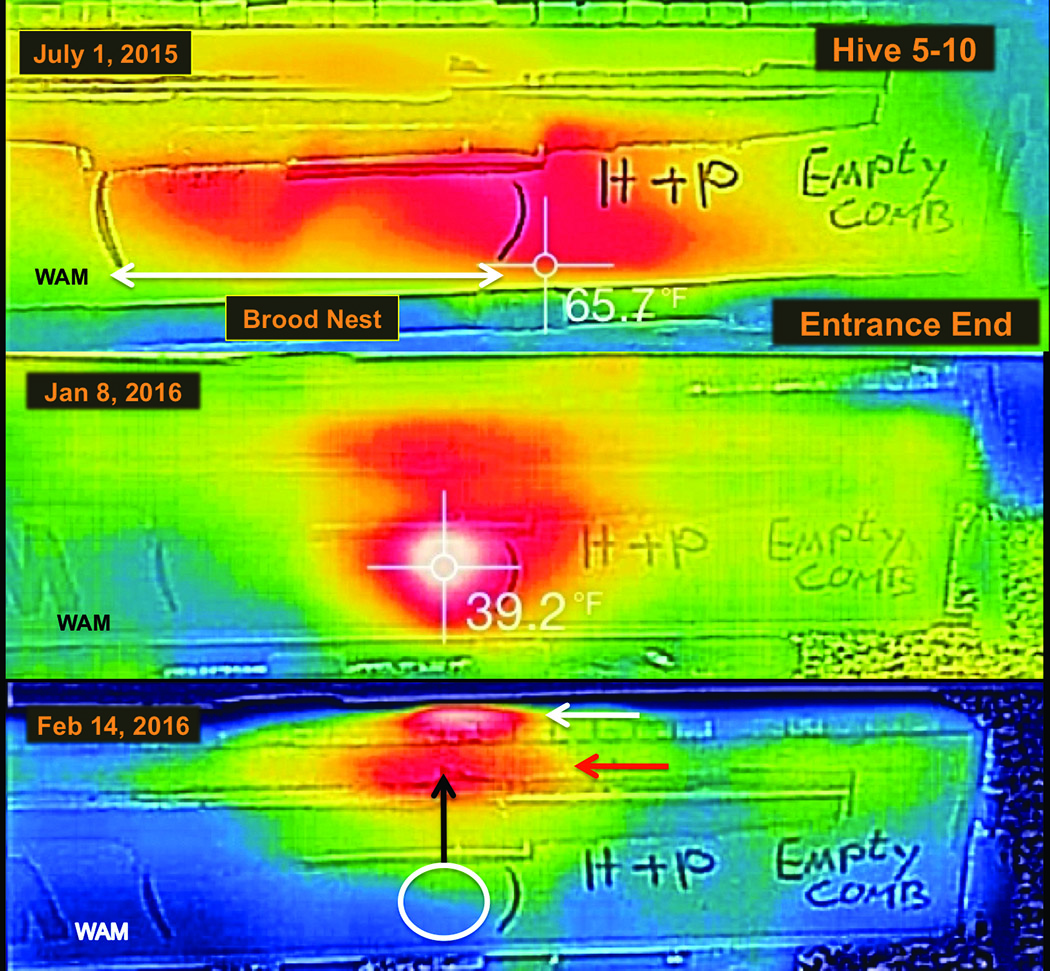
Figure 3.
Winter clusters showing abnormal heat signatures (relatively fast upward moves and/or becoming smaller) could perish in the Winter or survive into early Spring as weak nonviable colonies, a burden to the beekeeper. Both of these observations occurred with colony five to 10, which we met in the previous article because of its odd thermal behavior in the Summer. The warmest region of its heat signature did not completely align with its brood nest. For a complete comparison, Figure 3 begins by showing the strange Summer heat signature from hive five to 10 in the upper panel. The middle panel of Figure 3 shows the Winter-cluster heat signature in early January, which appeared apparently normal. The white (warmest) region was well within the entrance end of the former brood nest location from the Summer, a typical occurrence.
In February cold, I recorded the lower panel of Figure 3, the cluster showing difficulty. At first, I thought the colony had perished, finding no Winter cluster heat where the bees had been (the white circle). The bees had made a drastic move upward. They also had moved to the other side of the hive, over to the far upper corner of the combs, by the adjacent hive on the stand, essentially between two five-foot hives, a difficult place to take thermal images. If that location was the warmer side of the hive, it was very subtle.
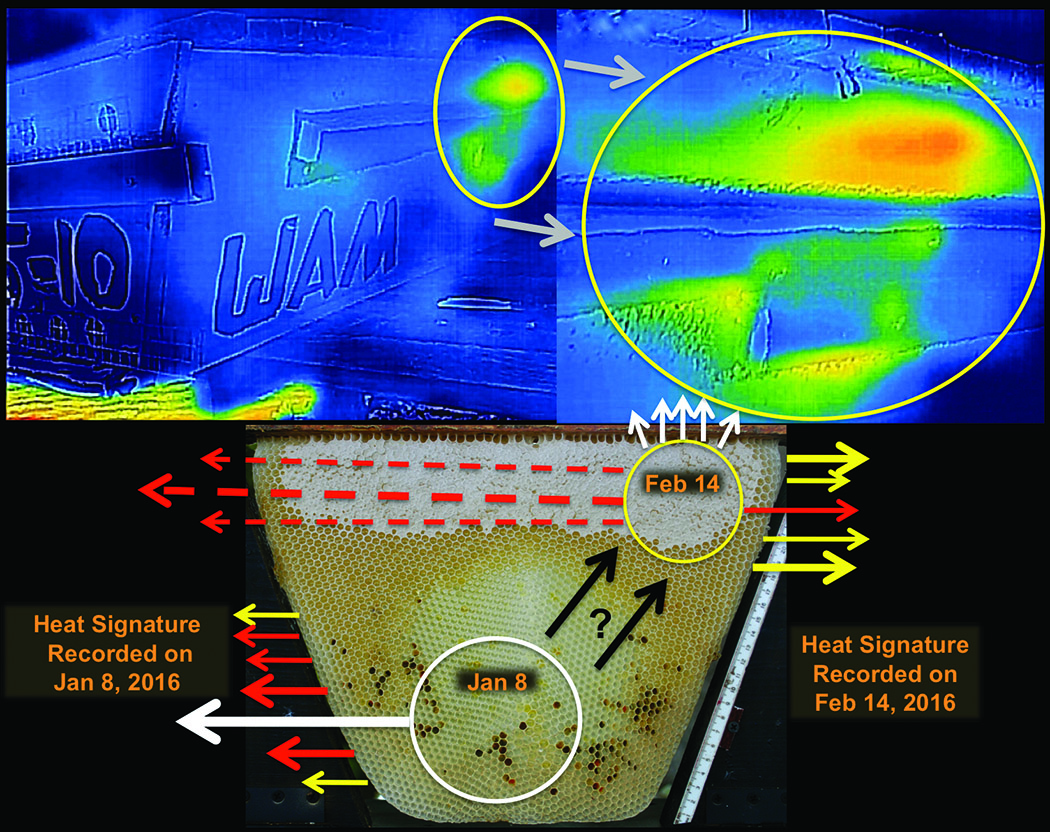
Figure 4.
Nevertheless, on the other side of hive five to 10, between the pair of hives, was part of the heat signature from a small cluster. It was just a splotch of yellow glowing in the dark thermal shadows. The upper left panel of Figure 4 shows it with a close up in the right panel. The lower panel of Figure 4 diagrams the possible movement of the cluster, using a comb (from another hive) as a natural background. (The comb has a honey band too narrow for Winter.) The lower white circle is the January 8, 2016 cluster position (Figure 3, middle panel), including its heat signature from the white core symbolized by the large white arrow. The cluster reached the yellow-circle position by February 14, 2016. By that time, the cluster was apparently smaller so I drew it that way (no scale implied).
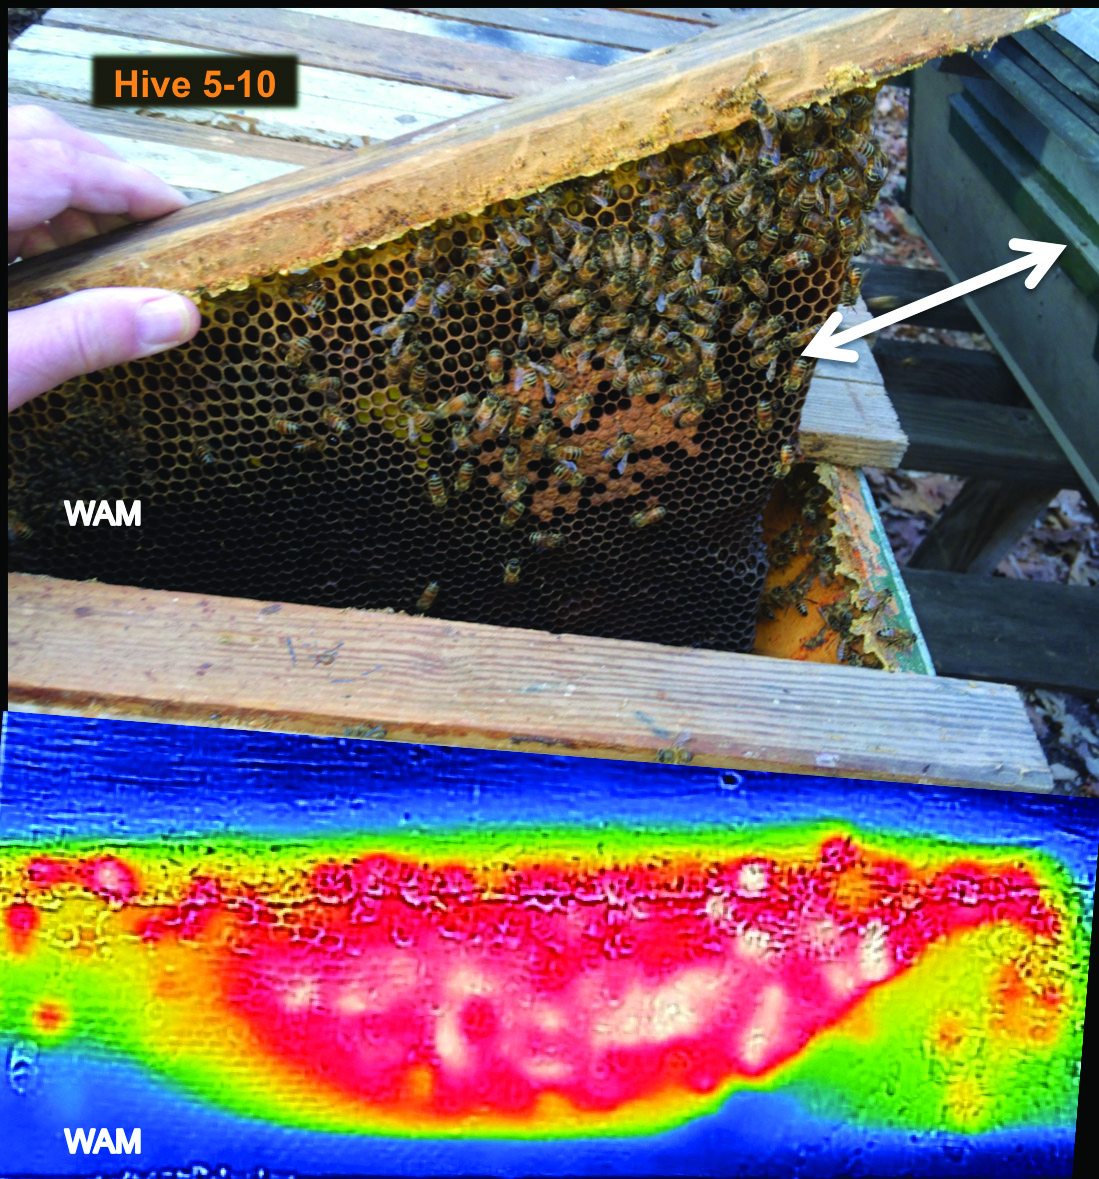
Figure 5.
In February the heat signature of the small cluster was too high up on the combs in its former honey bands. Inspecting hive five to 10, I verified a very small cluster and its location in the hive, all consistent with the thermal images (see Figure 5). The little cluster occupied the upper corners of three top-bar combs, extending into the former honey bands. Also troubling, the bees did not have much honey close by, the cluster liable to die by starvation with the return of cold. Beekeepers find these small clusters on their Spring inspections, but with the thermal camera, I am beginning to forecast them from Winter.
Occasionally, I let some weak colonies try to survive the Winter for observational purposes (rather than unite them with other colonies in the Fall). In early Summer, colony five to seven had been moderately strong. Then slowly the colony became weaker over the season; its main problem was an old queen with greatly reduced egg laying. Somehow colony five to seven managed to keep out robber bees, greater wax moths, and small hive beetles, our three main Summer scourges, besides Varroa mites and their viruses. Colony five to seven went into the Winter already too weak, beginning in the Fall already up in its honey bands, too high up on the combs.
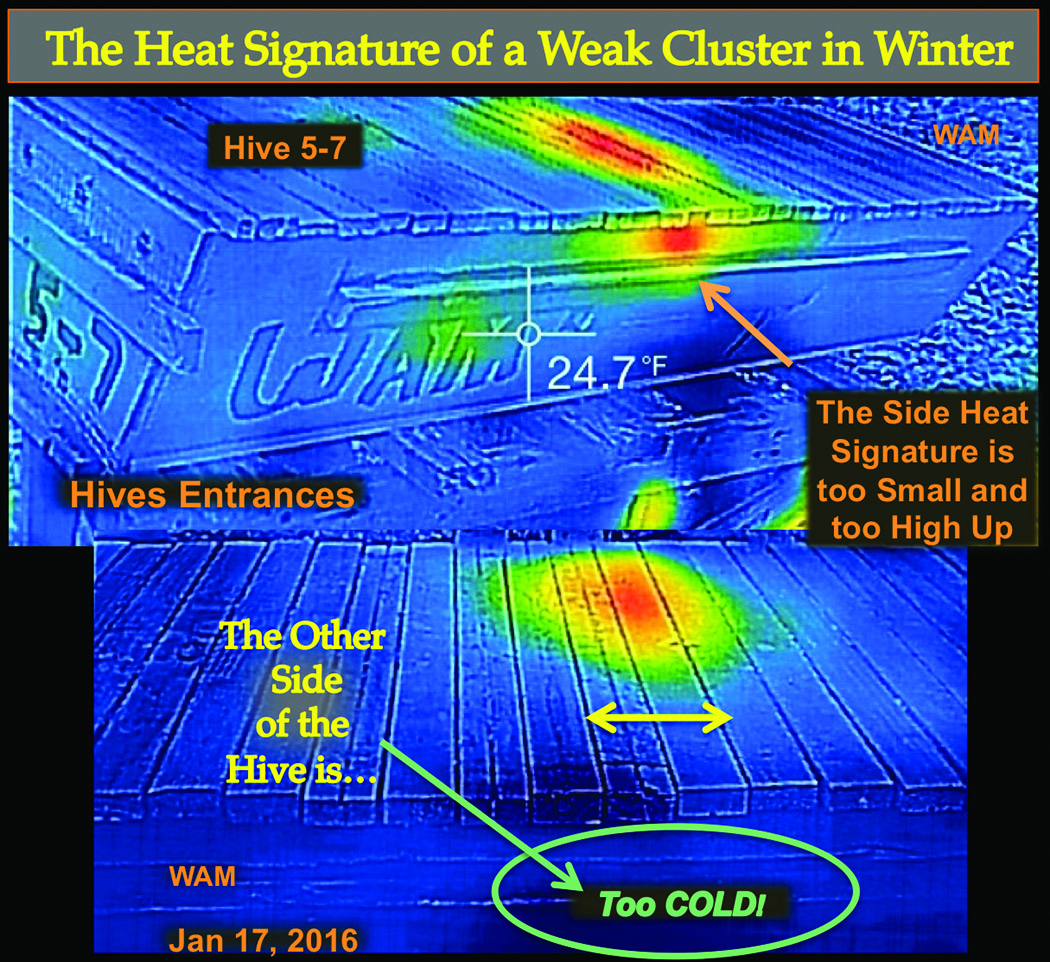
Figure 6.
Over the Winter, I recorded its small heat signature up in the honey bands (see Figure 6, upper panel). On the shady side of the hive, the camera detected no heat signature from the weak Winter cluster (see Figure 6, lower panel). The small heat signature never shifted position like the one in the previous example. The cluster was always in this upper position, although it must have been becoming smaller in size due to attrition. By February, still in Winter cold, before any early Spring inspections, I could not find the colony’s heat signature. Opening the hive showed the expected. The cluster had dwindled to a very small size and starved after losing contact with its surrounding honey.
The thermal camera changed my Winter and early Spring beekeeping from passive waiting to a more active watching. Extending that active watching (like data collection) to predicting Winter losses while still in Winter, one can easily construct the following strategy. Beekeepers go through the Winter monitoring their colonies, classifying them with perhaps (at least) two broad types of heat signatures, beginning in the first cold days of late Fall: wintering well, heat signatures showing large clusters wintering well (Figures 1 and 2) and even moderately strong colonies could go here; or problematic colonies, heat signatures showing some deleterious condition (Figures 3, 4 and 5). From proper Fall management, most all colonies should start in the first category (wintering well). During the Winter some colonies may move to the problematic category.
Now thermal-proficient beekeepers should be well prepared for early Spring inspections because even before then, while the weather is still too cold for colony inspections, they can pick up hive equipment from dead colonies getting a head start on clean up, and have it positioned ready for rapid deployment before the good-weather time crunch. They can pick up the nonproductive weak colonies too and handle them according to their management procedures.
“Thermal cameras with top-bar hives are on the cutting
edge of bee management, hopefully
making contributions to help all beekeepers.”
With the problematic hives mostly out of the way, and with warm weather arriving, beekeepers can concentrate Spring management on the stronger colonies, which sets the stage for the whole season. Keep in mind among these colonies some conditions may appear later to slow their growth, for example sudden queen failure or parasitic mite syndrome (the brood appears similar to a bad case of European foulbrood). For beekeepers working with limited help, or alone (like me), focusing on the stronger colonies, during the first warm days, would be a big advantage.
I’m making minor changes in my top-bar hive design and changing the hive layout in my apiaries, all with the goal of having a thermal-camera efficient top-bar hive operation. On Winter nights, I want to roll up on any apiary, pop out of the truck, leaving it idling, and walk around the hives recording one thermal video of their heat signatures. I narrate observational notes as I record while holding an extra bright (tactical) flashlight on the hives. Then I get in the truck; go to the next apiary, and make the next video. In a few hours, I can go through my entire operation, recording a video for each apiary. I have done test runs. It’s easy. I’ll be trying a similar procedure in the Spring and Summer too.
Thermal cameras with top-bar hives are on the cutting edge of bee management, hopefully making a contribution to help all beekeepers.
Acknowledgments
The author thanks Suzanne Sumner for her comments on the manuscript.