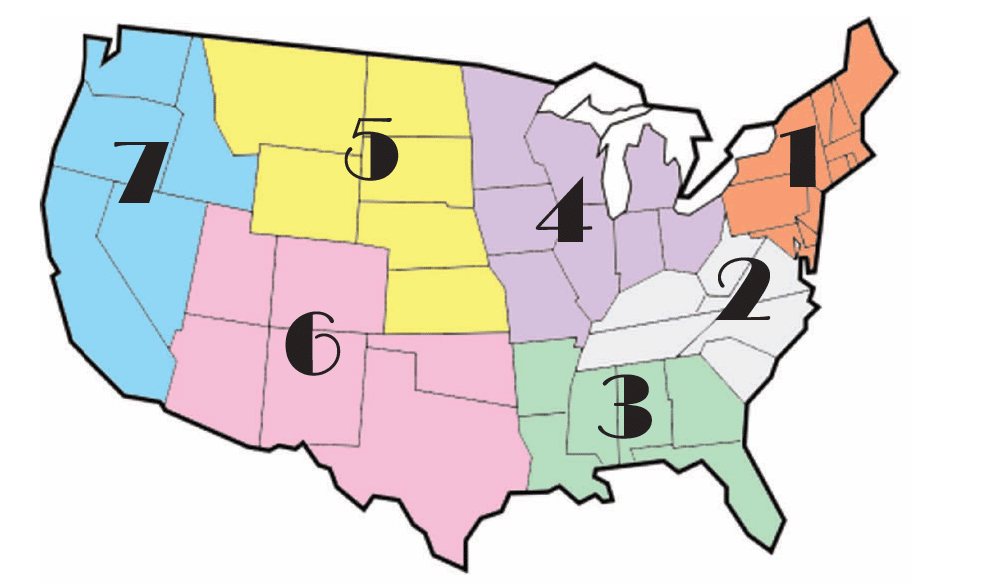
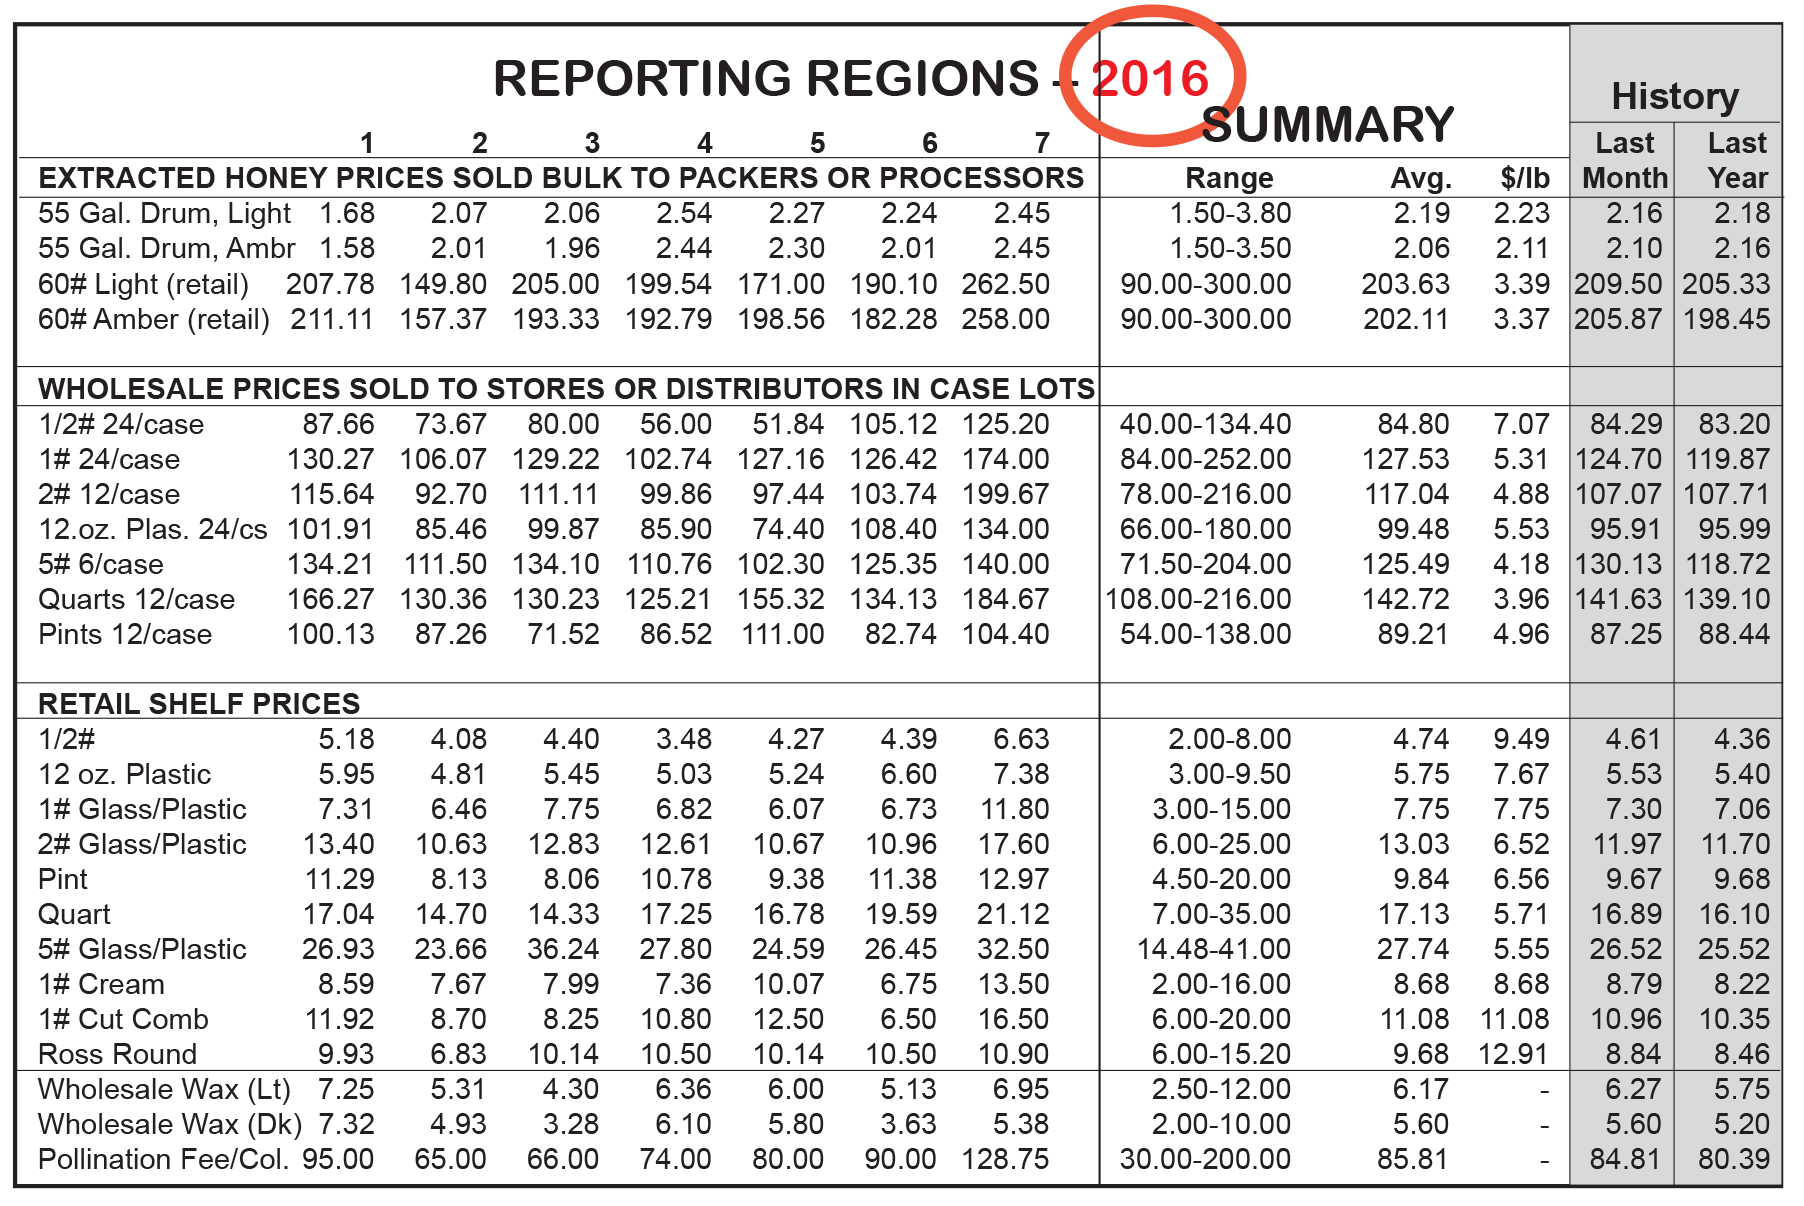
We’re throwing a lot of numbers at you this month but we think you’ll find them useful. Below is our monthly report from December 2015 and below that this month’s report. On the next page we offer a very different way of looking at the data we produce each month. But below you can see the difference for each product over the course of year, by region. You can look at yours and see what’s happened over the past 12 months.

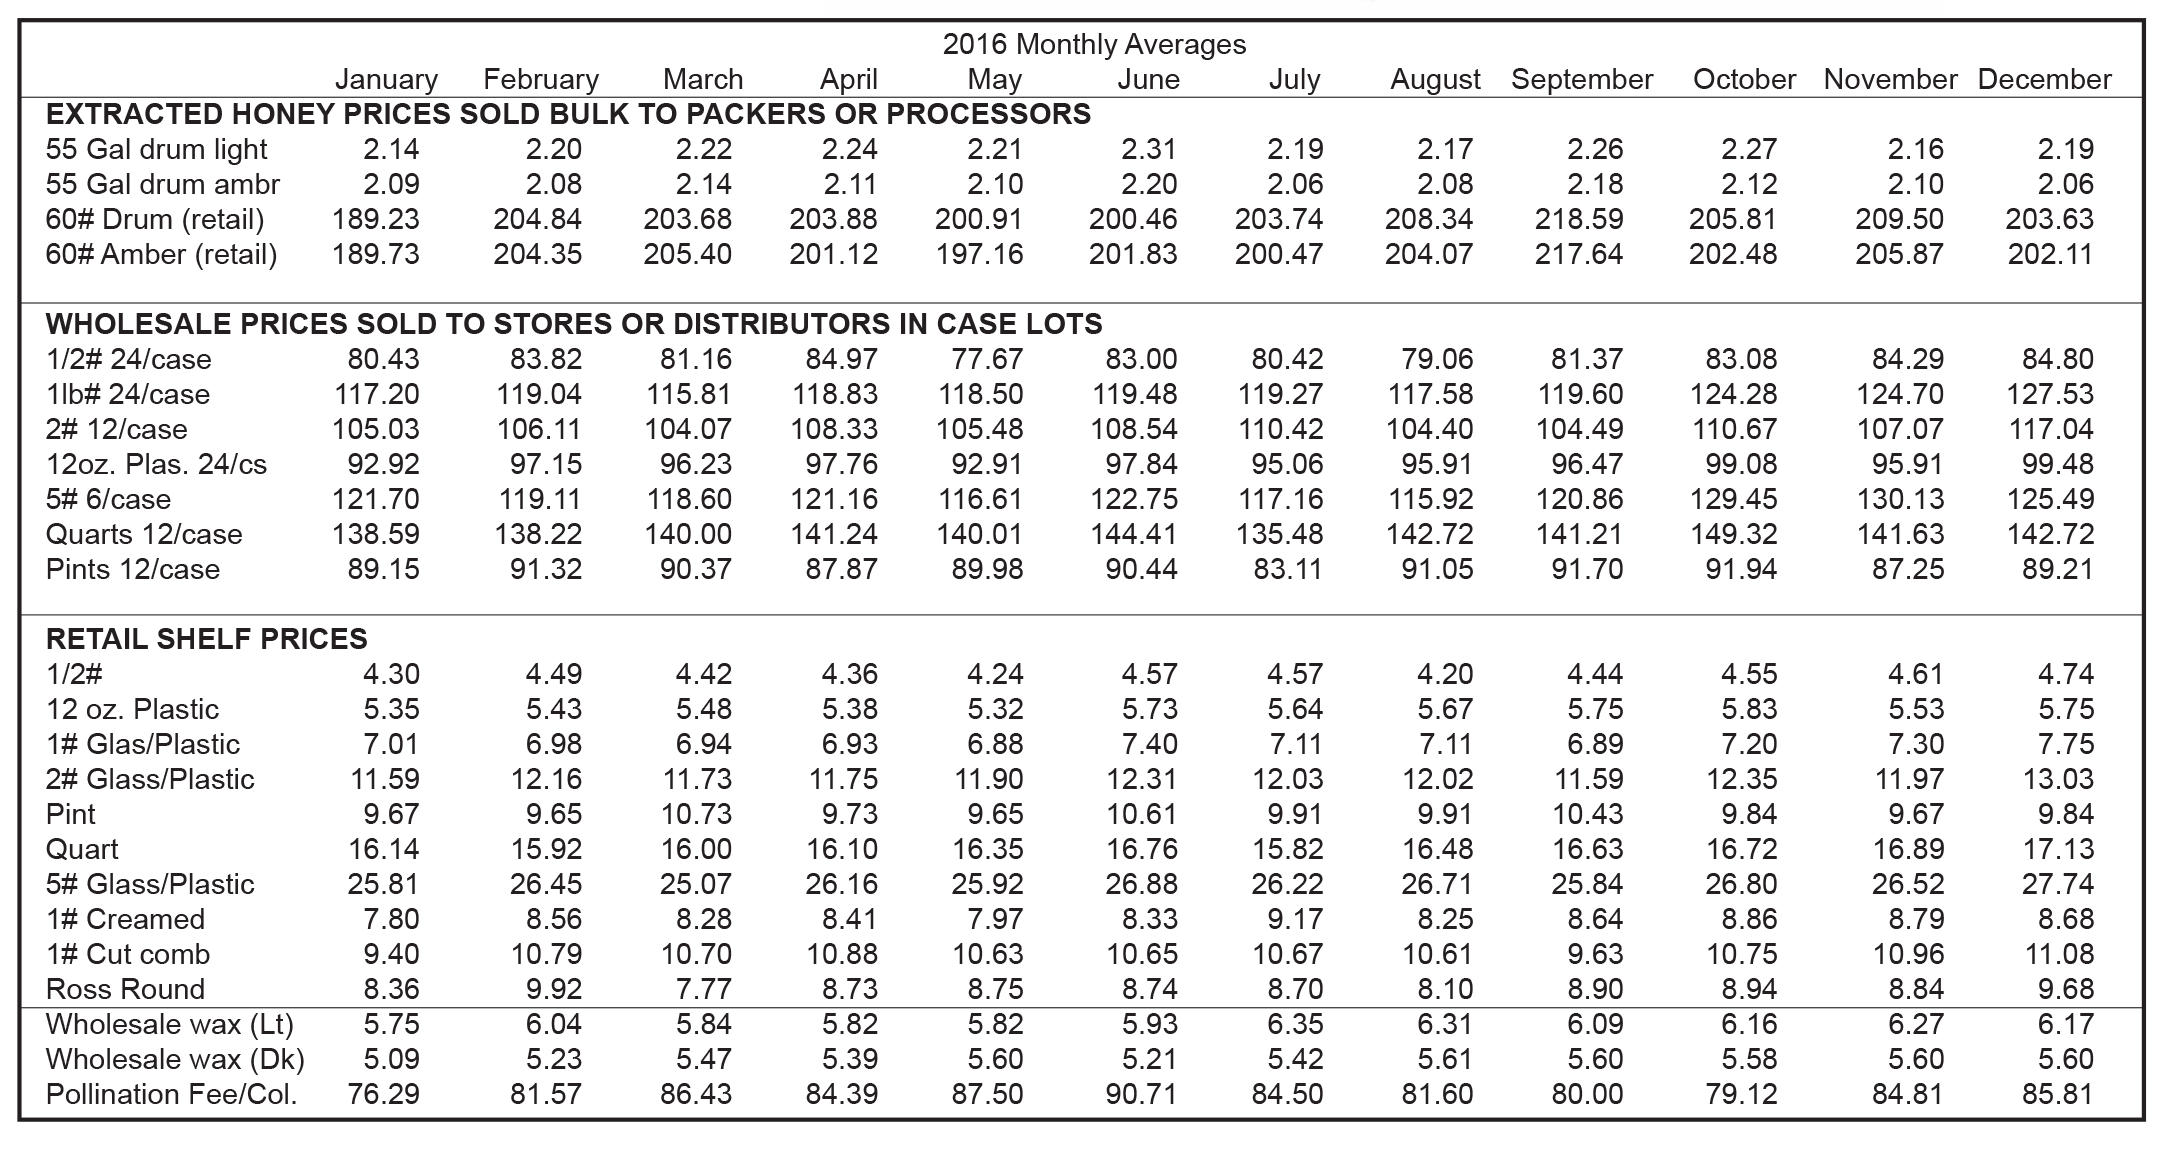
2016 Monthly Averages
The honey market is changing, and we wanted to see if looking at the average price for each unit across all regions every month told a better, or at least different story about what’s going on.
Part of this to remember is that our reporters don’t change much over the course of a year. Usually. When we lose one for whatever rea-son and replace him or her, and then look at what that individual person does to the average for that region…the blip, if any, is very minor. One person just doesn’t have that much effect overall.
 So, as you view prices for any one commodity over the 12 month period, you can be comfortable that the changes aren’t do to new people entering, or long time reporters leaving the fold, but rather, forces great-er than an individual are at play that are influencing the market.
Our market prices over the course of the year have risen 3% – 5% or so on the wholesale side of the equation, and that much, or a bit more on the retail side of equation. The cost of living increase during the same time has been less than that, so honey prices here have been healthy. This is in contrast to the bigger buyers, and sellers of bulk honey who have had to contend with a flood of much, much cheaper imported honey, primarily from India, Vietnam and South America. One factor to consider, however, is that only 20% or so of the honey consumed in the U. S. is produced domestically, and much of that is direct, local retail sales, which normally command a slightly to significantly higher price that poorer quality, imports.