


By Joseph Cazier & Walter Haefeker
Enough Data To Build A True Genius Hive.
Introduction
In previous articles in this series, such as “Peering Into the Future: The Path to the Genius Hive,” published in the April 2018 issue of Bee Culture, we discussed the importance of data science to build tools like the Genius Hive to benefit beekeepers. In this article, we will discuss one of the most critical components to building that future, large amounts of interchangeable standardized data related to bees, bee health, and hive outcomes.
It is only with this type of data, in large enough quantities and with sufficient quality, that it will become possible to build a true genius hive. Recall that this Genius Hive is one that can guide the hive management process by taking the collective wisdom from millions of hives to optimize the best outcome for the bees, beekeepers, and the crops they pollinate.
The best way to get the data needed to build tools such as a Genius Hive is to develop and adopt a data standard. In this case, a standard would be a consistent way of recording important data related to bees and beekeeping. If everyone recorded their data in the same way, it could be aggregated and analyzed to provide insights relevant to all of us.
To start the process of developing a data standard, a few of us, under the leadership of Walter Haefeker, President of the European Beekeepers Association and co-author on this article, proposed the formation of an Apimondia Working Group (AWG). This working group, AWG 15 for the Standardization of Data on Bees and Beekeeping, was approved during the Apimondia World Bee Congress in Turkey in October of 20171. AWG 15 will develop a standard for all data relevant to beekeepers, including human observation, hive sensors, environmental data, hive history, and genetics.
There is already a well-defined general technical language to let data flow freely between different systems. It is called Extensible Markup Language (XML). In this article, part one on the topic of standardization, we will focus on the benefits to all of adopting and using an XML based data standard we are calling BeeXML for the beekeeping sector2.
In this paper, we provide more detail on the how and why of data science than previous articles in this column to convey the potential of what could be achieved if we all work together to build and adopt a data standard like this. Specifically we focus on what could be done with data science to help bees and beekeepers everywhere with data from the open source data standard we are developing.
Next month, in part two of this series, we will address the technical challenges of building a data standard by going into the mechanics of BeeXML, and explain why XML is a good choice on which to build a data standard for our sector, followed by part three focused on human challenges like privacy issues to adopting a data sharing platform like BeeXML.
Data Science and Beekeeping
Data science is about making smarter decisions with data. The larger, more relevant and more trustworthy the data, the better the decisions one can make. Data scientists use sophisticated machine learning algorithms to test thousands of hypotheses simultaneously on hundreds (or more) possible variables impacting a decision or desired outcome.
Inputs for Good Data Science
A data scientist, for example, might look at weather patterns, geolocation, bee genetics, hive history, pest and pathogen vectors, nearby crops, biodiversity, and regional environmental factors to measure, predict, and ultimately improve, hive outcomes. This becomes possible due to the ability to control for variance across a wide variety of inputs and outputs. With enough data to analyze each item’s impact individually in various circumstances, along with likely interactions, we can begin to understand which factors are driving which outcomes under which conditions.
Once these factors are understood, they can be predicted. In reality, it often also works in reverse: sometimes you can predict things empirically, which are not well understood, but clearly associated with a high degree of statistical validity, and then go back to those things to see if a probable cause can be understood and validated. Most importantly, once something can be predicted and understood, measures can be taken to both avoid problems and optimize opportunities.
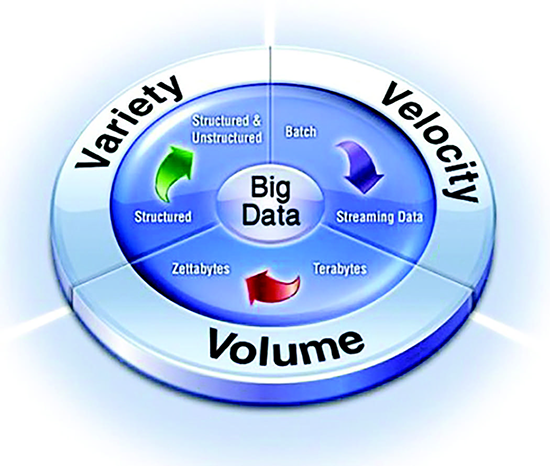
Figure 1. A depiction of the three V’s of Big Data3
How Science Works
Let’s take a moment to explain how and why this works. Most people are familiar with a controlled experiment or the concept of a double-blind clinical trial to test the effects of a potential new drug, such as the one depicted in Figure 1. In these cases, great care is taken to control for every type of variance possible (hence the name controlled). For example, researchers might control for physician or patient bias by making the experiment double-blind so neither the physicians nor the patients know whether they are getting the drug or placebo. This method controls for bias because even if physicians/patients love (or hate) the idea behind the drug, they cannot even unconsciously influence the experiment. In so doing, the researchers eliminate a possible source of bias and can then have more confidence in the results.
Randomizing the assigned treatment (receive drug) and control (receive placebo) has a similar effect in that it helps control for variations in people (or plants, or animals, or hives, etc.) being treated. The rationale is that even if there is a bias, such as a genetic variation in a participant, this bias will be distributed randomly, as opposed to systematically, and thus the results of the experiments can be trusted with a greater degree of certainty.
Randomized controlled experiments have long been the gold standard for advancing science, and for good reasons. By controlling for bias and variance, it gives us great confidence in the findings and helps science advance. This is especially true as the participant number (n) increases, because as the number of study participants experiencing an effect increases, the greater the confidence we also have in the effect. Likewise, if a study can be replicated (repeated by others with the same or similar results) that also increases our confidence in the efficacy of what we are testing as real.
How Data Science Approximates the Results
Let’s now look at how we can approximate this process with big data techniques. First, we should note that big data analytics techniques are a supplement to, not a replacement for, rigorous controlled experiments. However, both can help us learn what is true when it comes to medicine, bees, or anything else. The first key is in controlling for variance. As mentioned above, controlling for variance helps us have more confidence in the effectiveness of what we are testing: by controlling for other possible causes of the item being studied, we can eliminate them as key factors to consider and thus have more confidence that what we are studying is causing what we think it is.
Double-blind controlled experiments do this through randomization, participant matching, double-blindness, replication, mathematical modeling, or other means. In data science, we also control for variance, but we do this by having a large enough pool of data that we can observe what amounts to a series of natural experiments. By having enough data, thousands of times what you might have in a typical controlled experiment, trends emerge that can be naturally grouped together or clustered in a way that begin to show patterns that may imply (but not generally prove) cause and effect. These detected patterns can further be explored either through more data, time sequencing, an intervention, or a controlled experiment.
A Practical Application with Data Volume, Variety, and Velocity
Imagine that we have hundreds of thousands of beekeepers diligently recording, either through human observation or remote sensing, the state of their bees (primary data). Let’s further imagine that we can match this data to weather patterns from local weather stations in each area (secondary data). Let’s again imagine that we can use satellite images to look at the infrared reflective light pattern of plants growing in the area and identify which crops or natural plants are around a hive. Next, let’s assume we can extrapolate likely pesticide use near by, based on all of these factors (or, even better, records of actual use).
Finally, let’s imagine what could be done with hundreds of thousands of beekeepers around the world reliably sending primary data to a place that could merge them with secondary data and analyze them. This large volume of data, coupled with its variety (mostly from secondary sources), sent in near real time (velocity), and recorded over extended time periods, make up the three most famous Vs of Big Data (Volume, Variety and Velocity), as depicted in Figure 1.
Together these Vs form the basis for finding both similar and distinct data clusters and grouping them together in a way that controls for a large portion of the variance by, for example, holding weather, genetics, cropland, hive history, or other factors constant. By controlling for these factors, we can start to see what happens as only a few of those variables change. In this way, we can approximate the certainty of what we can learn from randomized controlled experiments, but much faster over a greater number of data points. The volume of data also generally leads to greater statistical power, enhancing the chances of finding an effect if it exists. As another bonus, because the data set is generally passively collected (especially the secondary data), it helps us avoid other confounds like the placebo effect or participant bias that often haunt medical trials.

Figure 2. An Apiary Management System from HiveTracks.com
Decision Support Systems
Once we control for these factors and apply these big data analytics techniques, we can usually distill the results down to a few understandable algorithms or rules that can be built into Decision Support Software (DSS), which is a data-driven software application to help people make smarter, faster and more efficient decisions. When loaded with the proper algorithms, this software system, or in this case Apiary Management System, can guide beekeepers by synthesizing the wisdom, knowledge, and experience of hundreds of thousands of beekeepers. This is what we aspire to build at HiveTracks.com as shown in Figure 2.
Note that one of the big challenges to building this type of decision support software will be getting the incentives right to encourage people to use the system and contribute their data to its continual improvement. We are keenly aware that some may have privacy and other concerns about this. While we don’t have space to address these privacy and data ownership concerns clearly in this paper, we plan to do so in a follow up devoted to this topic, part three of this series. This way we can keep the focus of this article on the benefits of adoption, part two on the technical mechanics and part three on the challenges and opportunities inherent in this type of data collection system.
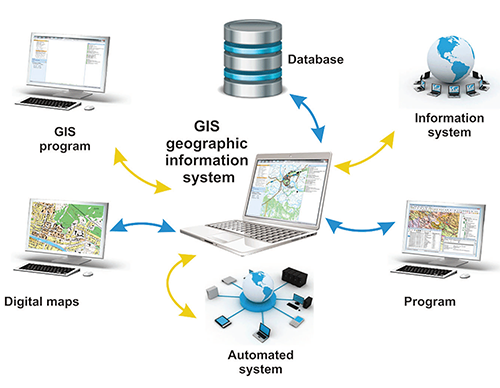
Figure 3. An illustration of a Geographic Information System.
Geographic Information Systems
In many cases, trouble can be avoided and opportunities addressed proactively, before they happen or while there is still time to take advantage of them. For example, I saw a presentation by Awad Hassan, from South Valley University in Egypt, at Apimondia 2017, on some of the work he and his colleagues are doing to integrate Geographic Information Systems (GIS) into their beekeeping operations. Figure 3 shows and illustration of an Apiary Management System enhanced with GIS technology.
As I recall, when they linked hive Global Positioning System (GPS) coordinates to satellite imagery of a regional oasis, they found that nearly 50% of the forage was going unpollinated (due to distance from the hive), which was suboptimal for both the plants and the amount of honey the bees were able to produce. This is an area where a guided decision support system enhanced with GIS technology and hive geolocation tags could provide a lot of value to migratory beekeepers and the crops their bees pollinate.
Status Alerts
A promising application for these decision support systems is in generating status alerts. After we apply the machine learning algorithms to our large amounts of data and distill out the key factors impacting an event, such as likely loss of a queen, an infestation of Asian Hornets, or a Varroa flare up, we can watch the incoming data and provide an alert early enough to be useful. Imagine receiving a text message from your hive, a week before your next planned inspection, telling you of a fluctuation in hive temperature, which very likely indicates that the queen is in trouble.
These applications can be applied with a lot less data and computer processing power because the insights and wisdom from the big data analysis can be distilled and encoded into Event Time Processing systems that can manage incoming data in real time.
These types of status alerts can be highly valuable to beekeepers and increase the chances of saving a hive or having better outcomes. The key is actionable information. The sooner you receive the relevant information, the sooner you can act on it and improve the current and future situation. However, it needs to be news you can use to be relevant and valuable beyond a post mortem scientific inquiry.
Predictive Alerts
While GIS systems are best if they are about the past (e.g. optimizing placement before moving your hive) and status alerts are about the present (e.g. what is happening now in the hive), predictive alerts are about the future. These alerts tell you what is likely to happen next to your hives. By looking at tens of thousands of similar hives in similar situations and comparing outcomes of those hives, we can build an algorithm, such as a decision tree or neural network, that can take all of the inputs into your hives and give probabilistic outcomes for various possible scenarios.
Optimization Algorithms
Another important outgrowth from applying data science to large amounts of standardized data is the ability to develop optimization algorithms optimized for a given hive in a given data cluster with a common set of important properties. Whereas prediction is about predicting the future, optimization is about creating the future you want.
Once these hive data clusters are properly identified for a given set of condition (e.g. Varroa infestation), we can then see how each hive data cluster has reacted to different treatment options in different states of a given condition. For example, perhaps a hive on the coast might do better with a given treatment then one in a mountain region (with a different history, genetics, and ambient environmental pressures), which might favor a different course of action for a similar condition.
As we have enough data to begin to understand all of these factors (this will take years of standardized data aggregated at a large scale), we can begin to embed optimization algorithms that will not only be able to predict the probability of a problem, but can also give a probability that a given treatment will work for your hives as opposed to a generic treatment.
The most essential aspect to making these technologies work for the beekeeping sector will be the topic of our next article. Using BeeXML, a special language and data standard, allows us to get the data we need to climb the mountain. This is a critical step that involves adopting a data standard and sharing the data in a way that can be used to benefit all bees and beekeepers. Without this standard, developing tools like the Genius Hive will take many times longer and be of lower utility. Please stay tuned for our article next month titled “BeeXML Part II: Achieving the Goal of Standardized Data” and than “BeeXML Part III: Data Challenges and Opportunities” the following month.
Figure 4. HiveTracks Logo and Motto – Know Your Bees.
Finally, special thanks to Project Apis m. for supporting a portion of this work with a Healthy Hives 2020 grant, to the publishers at Bee Culture for letting us share these ideas, and to Apimondia for creating this important working group (AWG15). Also special thanks to my friends at HiveTracks.com who are working with me to help build a Genius Hive so we can all know our bees better as shown by their logo in Figure 4. Our efforts would not be possible without visionary groups like these providing support and resources.
1https://www.efsa.europa.eu/sites/default/files/event/171204-0-p06.pdf
3https://blog.dellemc.com/en-us/mlb-a-big-fan-of-big-data/
Joseph Cazier is the Chief Analytics Officer for HiveTracks.com and the Director of the Center for Analytics Research and Education at Appalachian State University. You can reach him at joseph@hivetracks.com.
Walter Haefeker is a professional beekeeper from Upper Bavaria, board member of the German Professional Beekeepers Association , as well as President of the European Professional Beekeepers Association.