


By: Kim Flottum
Imports, exports, production and consumption from 2016.
A somewhat new look and a lot of new data come with the Department Of Agriculture’s National Agricultural Statistics Service Annual Honey Report this year, making the information more useful and offering a bigger, better picture of the U.S. Honey Industry. There are, of course, some of the usual issues with the data, but they are consistent with previous year’s data so are predictable.
Beginning this year new tables have been added with estimates on expenditures, incomes, and other data related to beekeeping.
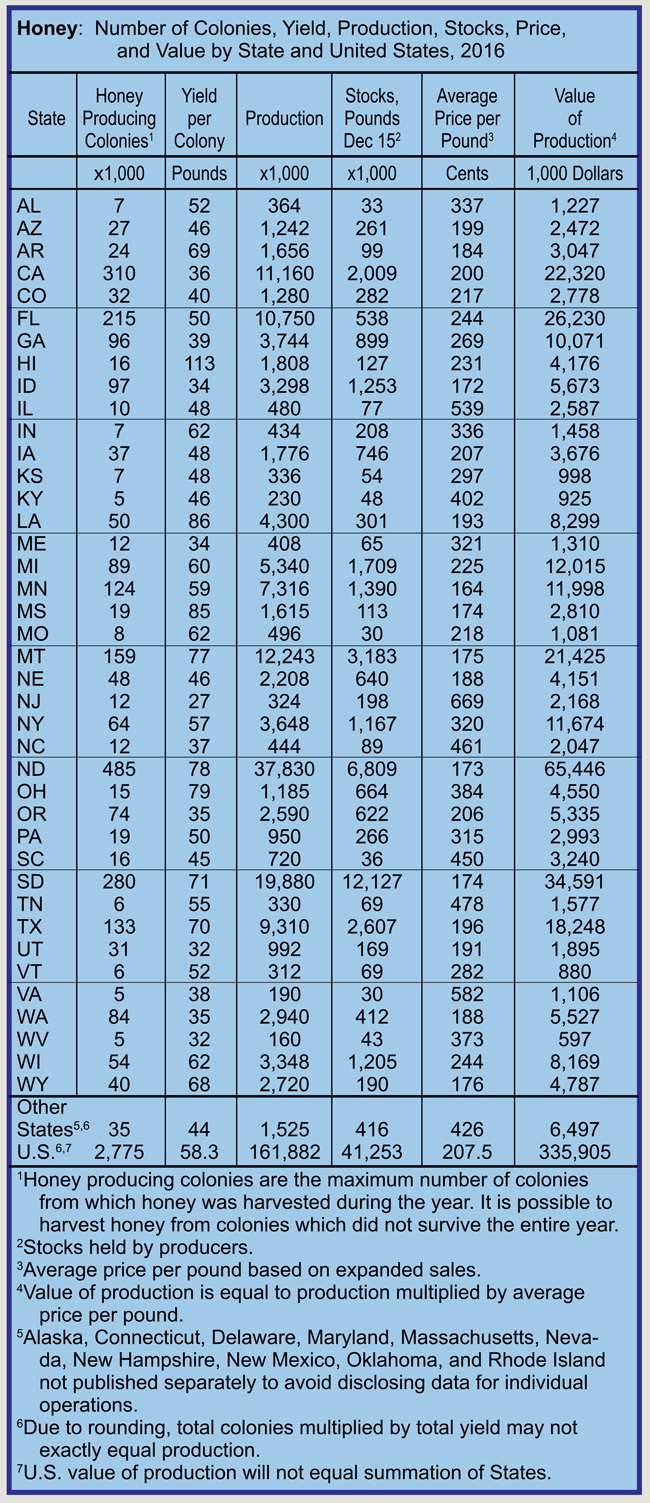
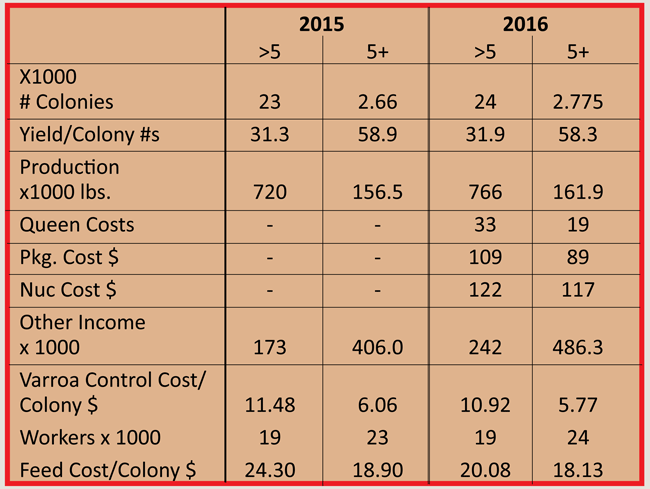
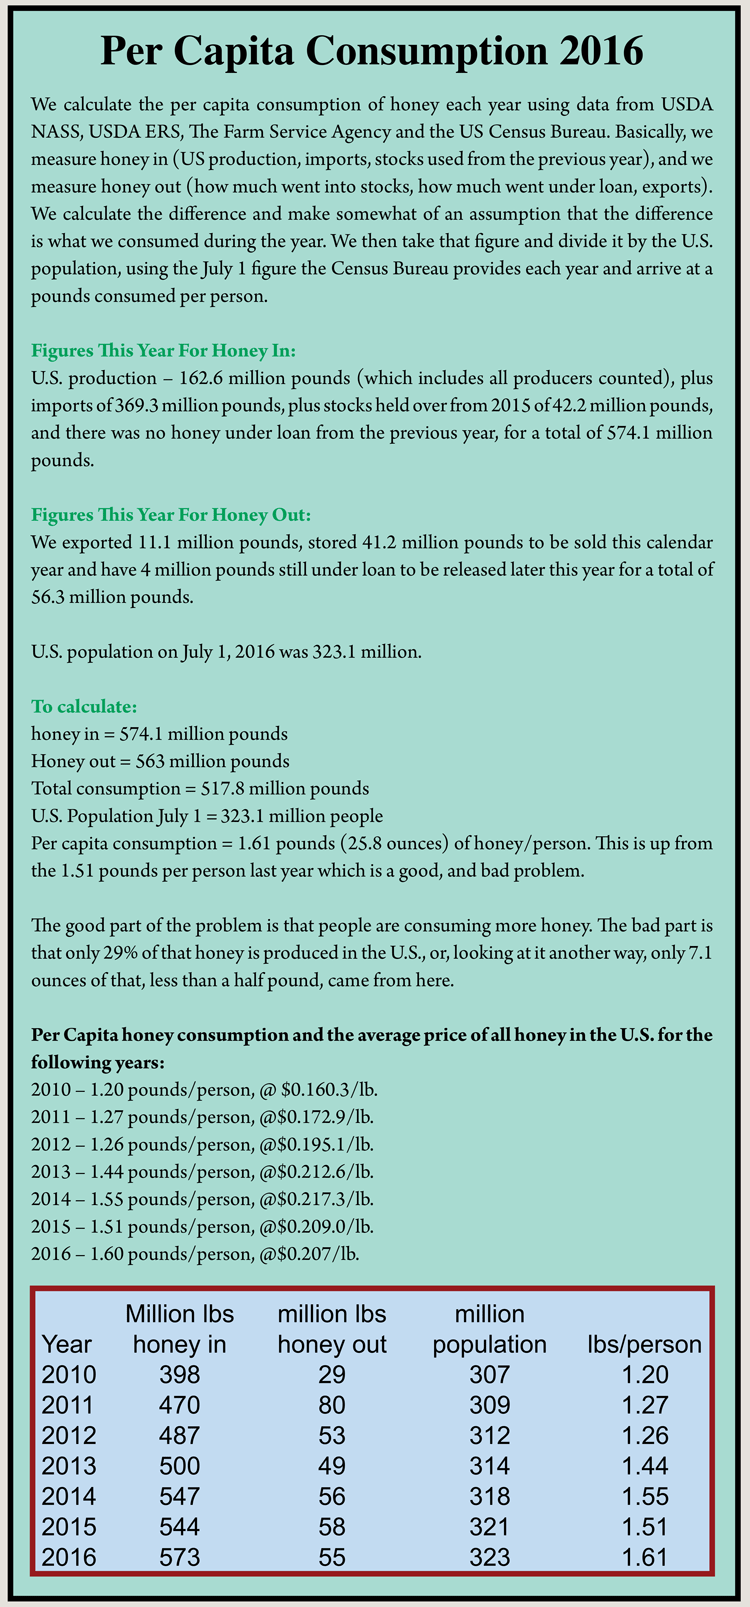
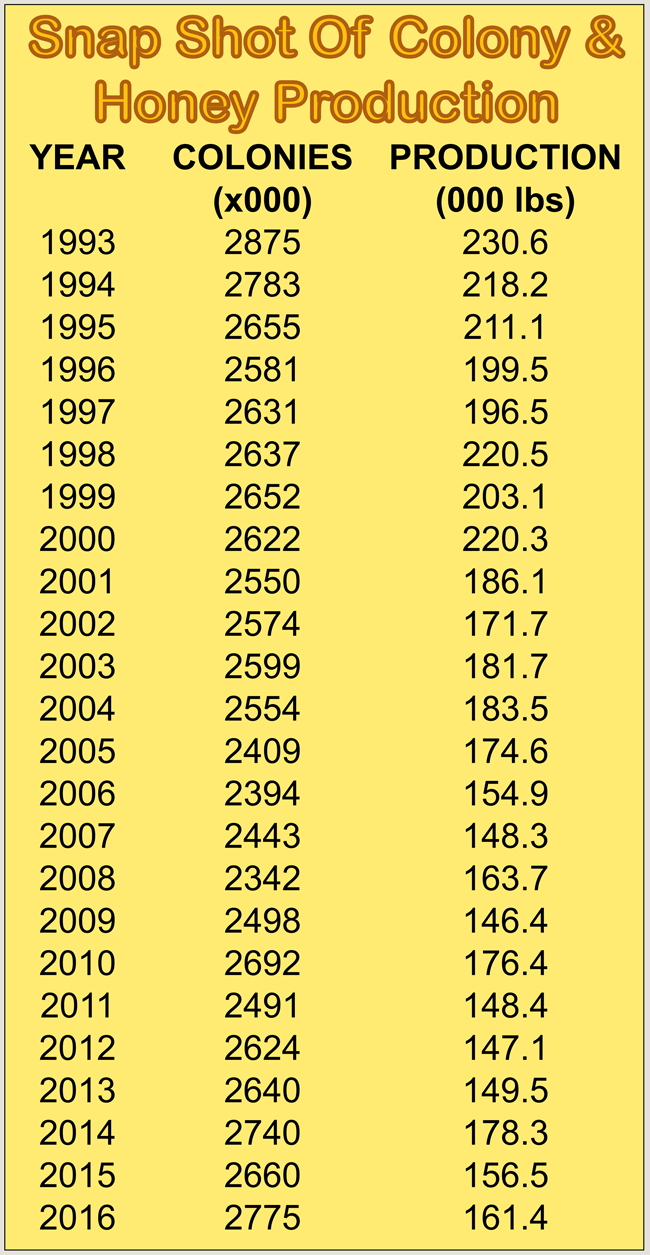
United States honey production in 2016 from producers with five or more colonies totaled 161.9 million pounds, up three percent from 2015. There were 2.78 million colonies from which honey was harvested in 2016, up four percent from 2015. Yield of honey harvested per colony averaged 58.3 pounds, down one percent from the 58.9 pounds in 2015. Colonies which produced honey in more than one State were counted in each State where the honey was produced. Therefore, at the United States level yield per colony may be understated, but total production would not be impacted. Colonies were not included if honey was not harvested. Producer honey stocks were 41.3 million pounds on December 15, 2016, down 2 percent from a year earlier. This means that honey was produced, but did not enter the stream of commerce so would not be counted as consumed in 2016. Stocks held by producers exclude those held under the commodity loan program, which also would not be considered as entering the stream of commerce, so would not be counted as being consumed in 2016.
United States honey production in 2016 from producers with fewer than five colonies totaled 766 thousand pounds, up 6 percent from 2015. There were 24 thousand colonies from which honey was harvested in 2016, up 4 percent from 2015. The average yield was 31.9 pounds per colony in 2016, up 2 percent from the previous year. This yield is 26.4 pounds less than what was harvested per colony on operations with five or more colonies. To be considered in this count the business where these colonies were kept needed to meet the USDA requirements of being a farm, thus excluding colony count and honey production from many backyard hobby beekeepers and even sideline beekeepers with more than just colonies in the backyard. Requirements for being a farm include being a business, taxes and the like, which most backyard beekeepers do not qualify for.
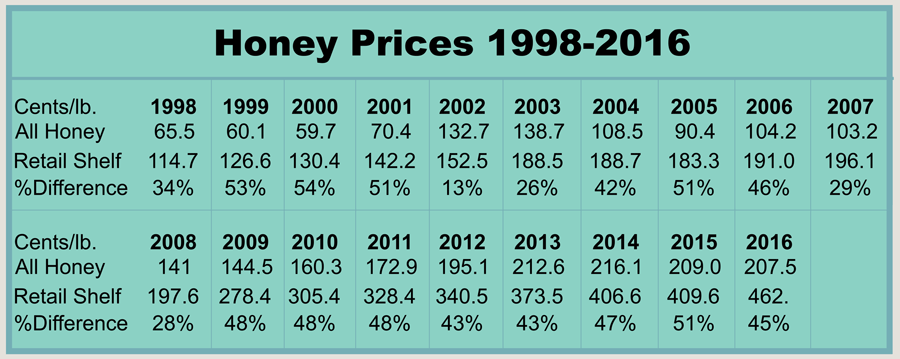
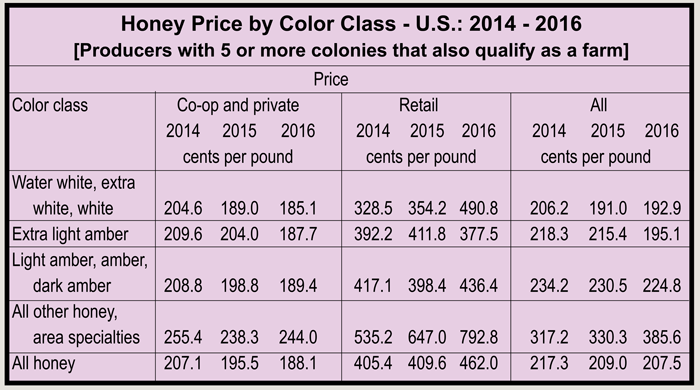
United States honey prices decreased during 2016 to 207.5 cents per pound, down slightly from 208.3 cents per pound in 2015. United States and State level prices reflect the portions of honey sold through cooperatives, private, and retail channels. Prices for each color class are derived by weighting the quantities sold for each marketing channel. Prices for the 2015 crop reflect honey sold in 2015 and 2016. Some 2015 honey was sold in 2016, which caused some revisions to the 2015 honey prices. Price data was not collected for operations with fewer than five colonies.
New on this report are prices paid for bees by operations with five or fewer colonies and for those with five or more colonies, the average prices paid in 2016 for honey bee queens, packages, and nucs were $19, $89, and $117 respectively. The average prices paid in 2016 for operations with fewer than five colonies were $33 per queen, $109 per package, and $122 per nuc. Comparable data is not available for 2015. For operations with five or more colonies, pollination income for 2016 was $338 million, down 1 percent from 2015. Other income from honey bees for operations with five or more colonies in 2016 was $149 million, or $56/colony, down 10 percent from 2015.
The NASS Honey Report this year is a whole new animal. They got a budget boost a while back and they have put it to good use in providing our industry with useful information. This year they have added a Cost Of Pollination Report, a Winter Loss Report, and a quarterly loss report which includes what caused those losses, additional information from those beekeepers who have five or fewer colonies, and are considered a farm by USDA (which, unfortunately, leaves out thousands of backyard beekeepers with five or fewer colonies), plus employee numbers, how much beekeepers paid for Varroa controls, feed, foundation, woodenware, and queens and nucs – all for both beekeepers with five or fewer and beekeepers with more than five colonies. It is an exhaustingly thorough report on where we are right now.
Bee Culture surveys its Honey Reporters each October for an estimate of what the honey crop will be, and we come pretty close to the right amount most years. In 2015 we missed it by less than 1%, the year before by 3%…not bad when dealing with millions of colonies out there. This year, well, for 2016 that is, we had predicted 168.5 million pounds of honey would be produced in the US, but NASS numbers indicate 161.9 million pounds were produced. We over estimated by 6.6 million pounds, about a 4% error. We’re happy with that, and when we looked at the numbers we were counting fewer colonies this year, which are up from last year by 100,000, from 2.7 to 2.8 million colonies, a 3% increase, so our guess was pretty good, given the data we had.
Five Or More, Or Less
Check out the chart that shows these numbers comparing the two groups. Varroa control costs/colony are enlightening. Fewer colony beekeepers are, according to the data, paying twice as much per colony to control Varroa as do larger beekeepers – $10.92 vs $5.77.
Conversely, the larger beekeepers are making essentially twice the honey per colony as the smaller beekeepers. Take a look at the rest of these differences on the chart.
The Top 10 Producing States
It’s still true. If you want to make a honey crop, these are the places to go. The top 10 jockey for position each year, but only the bottom one or two ever change. That happened this year, with NY dropping off from position 10 last year, while GA regained its position on the list with the help of a gain of 27,000 colonies since last year. Combined these 10 states command 70% of all the colonies counted in the U.S. and fully 75% of the honey produced here and those percentages, no matter the states involved are almost identical every year. A shift this year in this top 10 group shows they’ve gained 69,000 colonies since last year, with CA gaining 35,000, and GA gaining 27,000. But other states bear mentioning. ID +8,000, WA, +11,000, MT +13,000, NY +6,000, TX +7,000. Meanwhile, FL lost 5,000, and even ND lost 5,000, but SD dropped 10,000 and NE lost 9,000. Totaled, some states lost 37,000 colonies, but others gained, either by simply adding or moving colonies, about 112,00 colonies for the 2,775,000 total this year.
The rest is from off shore. And just where off shore, you ask? Well, let’s take a look.

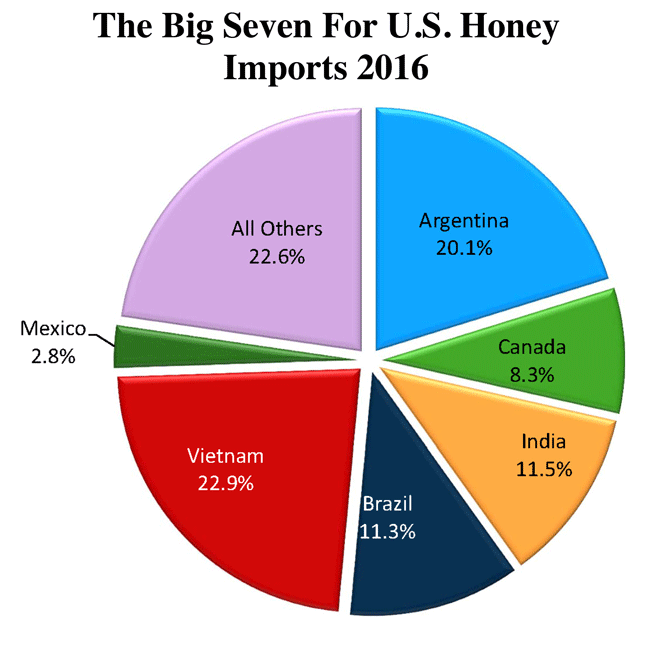
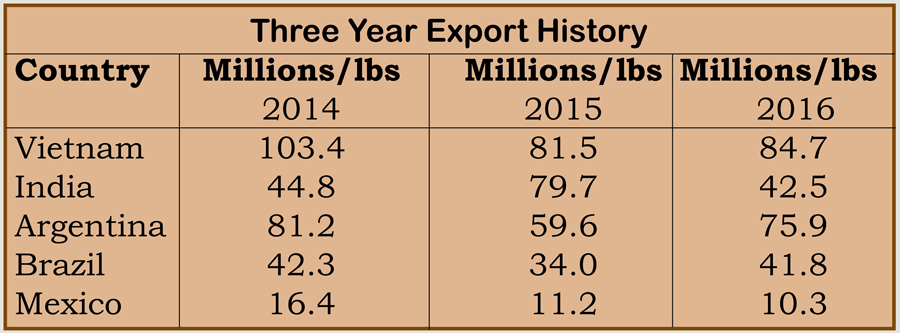
Essentially 75% of our imported honey comes from only five countries, officially. You can see on the graph how much of the total each country contributes, with Vietnam leading the way with 23%. Argentina is next with 20%, the other three total 31%. All the rest of the world only contributes just over 22%. The big change from last year of course is India sending less than half this year compared to last.
And what’s imported. Extra light amber and light amber account for 45% of what comes on shore. The rest is mostly white or undetermined color at about 30%. About 12% is reported to be organic, and almost all of that comes from the jungles of Brazil.
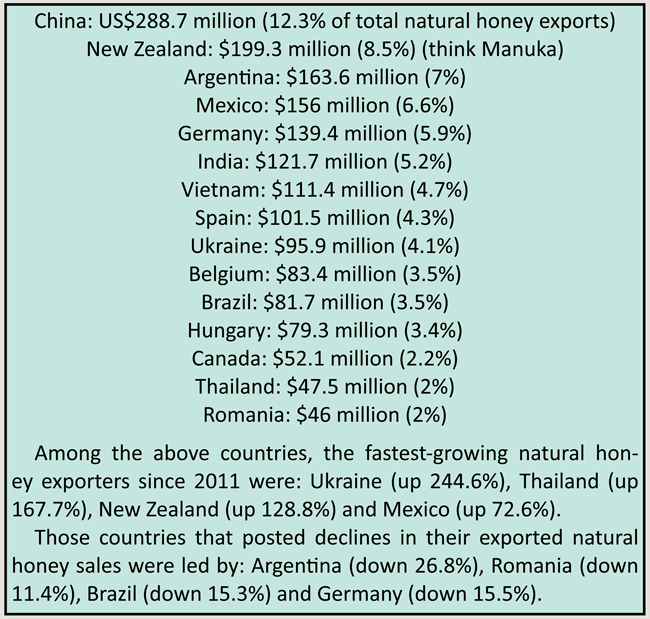
For comparison, the most recent data on global export dollar value countries is below. Dollars, not pounds
Below are the 15 countries that exported to all countries the highest dollar value worth of natural honey during 2015 (2016 data not included):
Prices
The header of the AMS National Honey Report for the month of January, 2017 states: Prices paid to beekeepers for extracted, unprocessed honey in major producing states by packer, handler and other large users, cents/pound, f.o.b. or delivered nearby, container exchanged or returned, prompt delivery and payment unless otherwise stated.
These prices range from a high of $2.50 for basswood in New York, to an average of about $1.60 for white to light amber. Import prices, however, are significantly lower, ranging from a low of $0.70 for light amber from Vietnam, $0.90 for extra light from Ukraine, to $0.97 for mixed flower from Canada, to as much as $2.50 for orange blossom from Brazil. Over a buck, however, is by far the exception, and only orange blossom commands that price. US beekeepers are, on average charging about $0.70/lb more for their honey than US packers can buy, apparently, imported honey for. This certainly is part of the reason the US is importing more honey than it is producing.
Conclusion
The data presented here adds to the observation that the US Honey industry is evolving into the US Pollination and Bee industry. Small operations, even though there are thousands of them, coupled with many more thousands of backyard beekeeping hobby beekeepers are producing very little honey in the scheme of things. And those beekeepers with thousands of colonies, though still making a mark in the amount of honey consumed here, are obviously focusing on producing bees – for their own use in pollination, and for other beekeepers, whether large or small for replacements, or for the smaller operations in the form of packages or nucs for starters, replacers or growth.
It is a slow evolution because keeping bees without making honey is, in many instances, difficult to do – bees make honey, that’s what they do. So, some is produced that can’t be recycled back into food for bees. But the labor cost of harvesting, extracting and dealing with this product, at less than $2.00 and often less than a buck a pound is becoming a financial drain. Bees, or pollination. That, it seems, is becoming the name of the game.