By R. Micheal Magnini
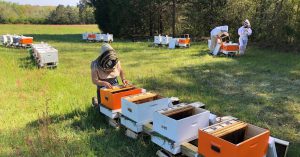
In part one of this article in May I outlined the availability of this technology to beekeepers, and its prospective uses. From here we shall look at the practical application of the technology as demonstrated here at my home apiary through the later part of the winter 2017.
After a brief reprieve in late February (a mid-winter thaw), the force and fury of the Cape Breton, Nova Scotia Winter returned on about March 1st. Although temperatures by continental standards would not be considered severe, a low of 1.5°F (-17°C), the accompanying winds reached 66 mph (106 km/hr) to 72 mph (115 km/hr) velocities. These winds, mostly northwesterly, were continuous for days at a time, with sustained velocities of 38 to 50 mph (60 to 80 km/hr). Needless to say, the wind-chill factor was severe.
These conditions caused concern for the health of my colonies to peak. I made daily forays to the hives and read their thermal signatures, took thermographs, and varied my approaches to the problem.
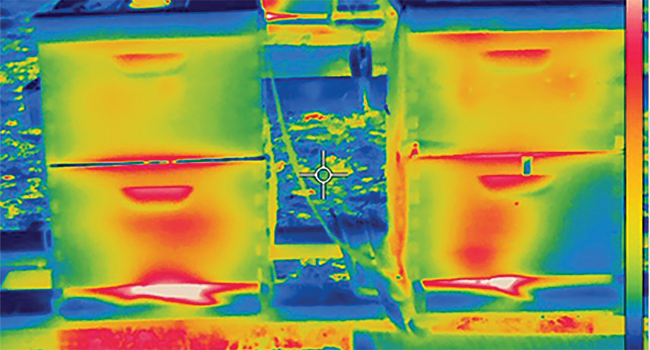
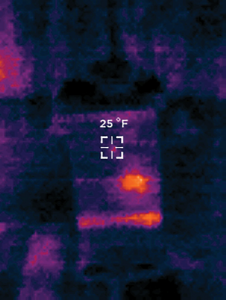
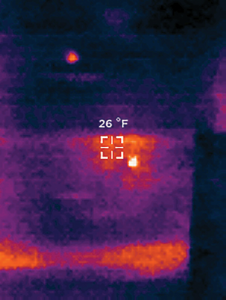
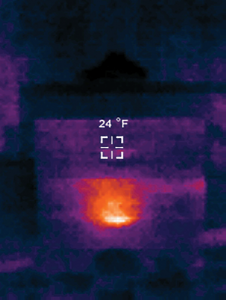
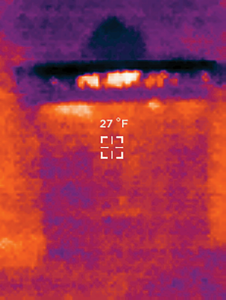
The March sunshine is bright while the sun is still low in the sky, and this caused some false readings. The black tarps used for hive wrap heated in the sunlight and prevented internal signatures from being read. To correct this problem I took two actions. To by pass the external heat of the hive body I focused the thermal camera onto and into the front entrance hole of the hive (see thermograph T1). The other approach was made at night, which produced better results in respect to internal heat signatures (thermograph T2 and T3). Some residual external heat was visible, but the differences were more pronounced.
-
- T1
-
- T2
-
- T3
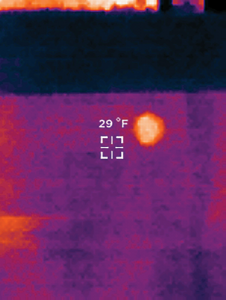
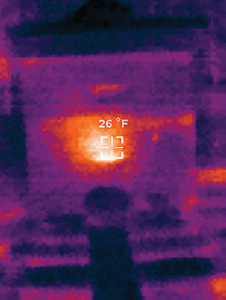
Readings taken at night produced some fascinating effects. When focused on strong colonies that had a distinctive localized cluster, and a bright spherical signature the individual bees could be seen moving around. (thermograph T4 and T5).
-
- T4
-
- T5
-
- T6
This effect of visibly moving bees has the advantage of eliminating false positives created by residual solar heating. It also provides confirmation of life, and precise location of the cluster. In some cases the cluster takes a rather flattened shape (usually at the top of the hive), or it may be spread out in a lower section. (thermograph T6)
Having now acquired the heat signature readings, some interpretations of the raw data should be made by the beekeeper. In the course of experience and developing techniques these interpretations would undoubtedly become a set of rules. Data collected, as in heat signatures and temperatures, become more significant when accumulated from all sides of the hive bodies. The elimination of extraneous thermal anomalies prepares the data for baseline comparisons from which the expected set of rules would be derived.
This would be a simple matter if the ambient temperature were a constant absolute. However, as our ‘laboratory’ is in the context of the natural environment other factors need to be considered. The living organism of the bee colony will be subject to such environmental factors of the atmosphere as humidity, concentration of CO2, and most acutely the thermal effects of wind chill.
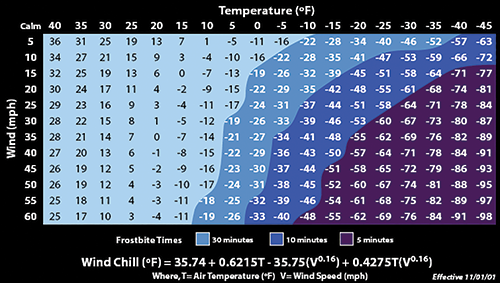
In the highlands of Cape Breton, as well as any other coastal or elevated and exposed areas, winds become the force majeure in the struggle for survival of honey bee colonies. Wind chill calculating equations, and charts, are widely available from climate based data banks such as NOAA, Environment Canada, and your local weather station.
The effects of wind chill are caused by the increased convection of heat away from the exposed surface. The rate of convection depends on both the difference in temperature between the surface and the fluid (air) surrounding it and the velocity of that fluid with respect to the surface. As convection from a warm surface heats the air around it, an insulating boundary layer of warm air forms against the surface. Moving air disrupts this boundary layer, allowing for cooler air to replace the warm air against the surface. The faster the wind speed, the more readily the surface cools.
The original formula for the index is:
WCI = (10 √V – V + 10.5) x (33 – T)
WCI = Wind chill index, kcal/m2/h
V = Wind velocity, m/s
T = Air temperature, °C
Several other formulas are in use by meteorological services such as Environment Canada and NOAA in the United States. The 2007 McMillan Coefficient calculates wind chill by subtracting the wind speed in mph from the Fahrenheit temperature. The 2012 Breedlove Coefficient subtracts the temperature in Fahrenheit from the wind speed rather than subtracting the wind speed in mph from the Fahrenheit temperature.
Although the object’s surface temperature cannot be reduced below the ambient air temperature, the rate at which it drops increases with the wind’s velocity. The total heat loss then, usually measured in BTUs, increases.1
The physiological response of biological organisms, such as honey bees, is to generate more heat to replace the lost thermal energy from heat transfer to the exterior environment.
Heat regulation is critical to the survival of the honey bee cluster in winter. The heat that is primarily generated in the core of the cluster maintains the colony between an upper and lower limit. The mantle (outer layer of bees) of the cluster sustains a lower temperature as it acts as an insulating barrier. The lower limit of the bees is 41°F (5°C). At this temperature the bees are unable to produce metabolic heat and stop moving.
‘One aim of thermoregulation is to keep the peripheral temperature above +5°C. When the ambient temperature drops in the course of a Winter night, the core temperature rises by more than 10°C and stabilizes the peripheral value at around +6°C. On the other hand, increasing ambient temperatures in a Winter morning results in a lowering of the central temperature by 8°C while the periphery warms up slowly. Plotting the temperature Tc of the center versus the ambient temperature Ta gives two straight lines with a slope of + 15°C/ -10°C and -10°C / + 10°C for falling and rising ambient values, respectively. The heat loss from the cluster is proportional to its momentary surface, the heat conductance through the surface and the temperature difference between the periphery and the surroundings. This loss has to be compensated by the heat production of the bees in the cluster. The reduced heat loss through the surface and the increased heat production in the cluster lead to a temperature rise in the core. [Plotting] shows a linear relationship between the central temperature and the temperature difference between periphery and environment over a wide temperature range. The accumulation of data at T = 10°C again points to the economic aspect of thermoregulation.
The temperature in the centre of an overwintering cluster is maintained at an average value of 21.3°C (min 12.0°C, max 33.5°C). With rising ambient temperatures the central temperature of a winter cluster drops whereas the peripheral temperature increases slightly. With decreasing external temperatures the peripheral temperature is lowered by a small amount while the cluster’s center temperature is raised. Linear relationships are observed between the central and the ambient temperature and between the central temperature and the temperature difference of the peripheral and the ambient temperatures. The slopes point to two minimum threshold values for the central (15°C) and the peripheral temperature (5°C) which should not be transgressed in an overwintering cluster.’ 2
From this description of thermoregulation, and its upper and lower limits in regard to temperature, it is evident that the heat transfer from inside the hive to the outside must not exceed the cluster’s capacity to produce the required thermal balance.
To assist us in quantifying the heat parameters of an overwintering bee colony we shall attempt the following calculations.
The basic formula for heat loss (transfer) is:
Heat transfer = surface area x (temp A – temp B) /R
Surface area shall be considered the four vertical sides of a Langstroth double hive body. We will consider the bottom board and top lid to be less exposed and better insulated. Thus the surface area involved in our calculation shall be equal to 1460 sq in, or 10.13 feet square. The R-value (insulating coefficient) of pine wood (1”) is 1.25.
Temperature A is the internal average heat, and temperature B is the ambient outside temperature. From our thermographs it can be seen that the heat in the cavity around the cluster is cool, and would be no warmer than the temperature of the cluster’s mantle. We will calculate for minimum and maximum mantle temperatures.
With these parameters selected we can now begin our calculations.
Heat Loss = 10.13’ x (41°F – 5°F)/1.25
= 291 btu / hr
Now if we calculate at the upper cluster temperature.
Heat Loss = 10.13 x (50°F – 5°F)/1.25
= 364 btu / hr.
From these calculations it is evident that the minor insulating value of wooden hives, and the relatively large surface areas causes rather extreme heat loss. If our overwintering colony was entrenched in the hollow of a tree the surface area would be much reduced (cylinder vs. cube), and the thickness (and R-value) would be increased.
Let’s try a hypothetical calculation.
Assume a tree of 18 inch diameter with three inch thick walls. The surface area becomes 56.5 x 20” = 1130” or 7.85 square feet.
Heat Loss = 7.85 x (41°F – 5°F)/3.75
= 75.36 btu/hr
Obviously, the rectangular dimensions of the common beehive has inherent disadvantages to the natural habitat of wintering honey bees. It becomes imperative then that beekeepers modify their wintering bee colonies to reduce excessive heat loss and mitigate the ensuing colony mortality when the thermal limits are exceeded.
There are, of course, other more complicated formulas for detecting heat loss and transfer, but I would think that the above calculations would provide quod erat demonstrandum (QED) of the risk to bee colonies in unprotected hives.
It would seem at this point that a value for the heat produced by a winter cluster of honey bees would prove to be useful. In my search for this value I was unable to locate any research in this regard. However, I have found a measurement of the heat produced by one bee! If we can do some simple arithmetic the total heat produced by a cluster should be found.
We will estimate that a Winter cluster should consist of 10,000 (min.) to 20,000 (max,) bees. To this number we should multiply our thermal unit (heat produced by one bee).
From L. Fahrenholz, I. Lamprecht, and B. Schricker we obtain:
Microcalorimetric determinations of the heat production were performed on the three castes of the honey bee: workers, drones and queens of different ages. Among these groups single adult workers showed the highest heat production rates (209 mW·g−1) with only negligible fluctuations in the heat production rate. Juvenile workers exhibited a mean heat production rate of 142 mW·g−1. The rate of heat production of adult workers is strongly dependent upon the number of bees together in a group. With more than 10 individuals weight-specific heat dissipation remains constant with increasing group sizes at a level approximately 1/17 that of an isolated bee.3
Thus, taking the strong heat production of adult workers – as would be expected in a winter cluster – the calculation becomes: 209 mW x g –1 x 10 4.
= 209 mW x g 3
For a three pound cluster (1362 grams): 1362 x 209 = 284,658 mW
= 284.658 Watts
1 W = 3.412 btu
Thus 284.658 x 3.412 = 971.25 btu/hr.
At this point we have a sustainable equilibrium based on a healthy cluster of sufficient size and a calm ambient air temperature. Other factors can upset this balance.
A weak colony of reduced size would not produce this level of heat; wind chill that increases the rate of heat loss; and infiltration of cold air through cracks, holes and vents. In conditions of high wind the infiltration factor can be severe.
Let’s presume that the wind chill has the effect of “equivalent” temperature. If we plug these numbers into our heat loss formula the status of the colony changes drastically.
Heat Loss = 10.13 x (41°F – (-31°F))/1.25
= 583.5 btu/hr
As the cluster shrinks through the course of the Winter (a normal attrition), and the winds continue, the difference between heat production and heat loss diminishes and quite often it reaches the vanishing point.
Beekeeping in the Summer is fun. Beekeeping in the Winter is hard work. Thermography is a multifunctional asset, and the application of this technology to beekeeping should enhance and advance the practical aspects of modern apiculture.
Apologies for any errors I may have made in the above calculations.
References:
1BTU, British Thermal Unit: heat required to raise one pound of water 1°F.
2,3Journal of Comparative and Environmental Physiology B Thermal Investigations of a Honey Bee Colony: L. Fahrenholz, I. Lamprecht, and B. Schricker
Universitait Berlin, K6nigin-Luise-Strasse 1-3, D-1000 Berlin 33, Institut fiir Biophysik der Freien Universit/it Berlin, Thielallee 63, D-1000 Berlin 33 Accepted July 11, 1989