The Bee Informed Partnership Colony Loss and National Management Survey for 2018-2019 is Now Live!
April Truths (about the Bee Informed Partnership’s Survey)
Geoff Williams1, Selina Bruckner1, Karen Rennich2, and Nathalie Steinhauer2
1Auburn University & 2University of Maryland
The month of April is known for many things – rain showers, Easter bunnies, practical jokes, and heck, even one of the author’s birthday! For beekeepers, April also signifies the time of year when most across the country have had more than a little peak inside their hives to see what’s going on after winter. This is why for over a decade, April is when the Bee Informed Partnership opens up its National Colony Loss & Management Survey to beekeepers across the country. Given that this month traditionally starts out with a few tricks, we thought we’d counter this culture with some TRUTHS about the Bee Informed Partnership’s Surveys!
This is the survey’s 13th year (well kind of)
The precursor to the Bee Informed Partnership’s first ever survey was conducted collaboratively with the Apiary Inspectors of America way back in the spring of 2007. This was when the iPod Touch was the most common Christmas present of the year! Basically, an iPhone without the phone part! Anyways… the Survey was primarily a response to Colony Collapse Disorder that was first reported the previous fall in a number of operations across the country. At this point, there had not been a nation-wide survey of winter colony mortality, so information on ‘normal’ levels of mortality, or important factors correlated to mortality, was few and far between. The first few surveys were conducted over the telephone. It was not until the spring of 2010 that an online version of the loss survey went out to beekeepers. The Bee Informed Partnership was formed in the spring of 2011 after being awarded a USDA grant. Thereafter, it began to formally conduct an annual loss survey to obtain baseline information of colony mortality during this critical period of the beekeeping calendar. Although the Survey is no longer federally funded, the Bee Informed Partnership continues with it because its data are so important to our industry!
Winter colony mortality questions have been the bread and butter of the Bee Informed Partnership’s Survey ever since its inception. But today, the Survey is so much more. For example, we all know that colonies don’t just die in the winter. Therefore since 2010/11 we now calculate summer and annual losses, in addition to winter loss. We also know that population health information, like number of dying colonies, is very important to understanding the beekeeping industry, but it’s only the start. That’s why questions examining beekeeping management, demographics, and socio-economic situation were introduced to the survey starting in 2010/11. That was a big year for us! This year’s Survey, like last year’s, consists of three parts. Each contain questions designed to maximize our knowledge of potentially important drivers of honey bee colony mortality – 1. Colony Losses, 2. Beekeeper Management, and 3. Socio-economics.
Nearly 50,000 thousand survey respondents representing over 6 million colonies
To date the Survey has received more than 50,000 responses! The majority of these – over 40,000 – have come from Backyard Beekeepers. These folks manage fewer than 50 colonies. The remaining responses have come from Sideline and Commercial Beekeepers. The former group, which manages 51 to 500 colonies each, have provided nearly 2,000 submissions, whereas the latter group, which manages more than 500 colonies each, have submitted just over 1,000 responses. Despite having a greater number of Backyard Beekeeper respondents, by and large Commercial Beekeepers still represent more colonies. For example, during the 2015/16 Survey, 5,597 Backyard Beekeeper respondents collectively managed 39,170 colonies, whereas 98 Commercial Beekeeper respondents managed 655,623. Sideline Beekeepers were somewhere in the middle!
Just because we have received over 50,000 responses to the Survey over the years, it doesn’t mean that each represents a unique beekeeper. We believe some participants re-visit the survey every year (and we thank you!!!), whereas others come and go. Because our Survey is anonymous, we have no way of telling for sure. One thing we do know is that we have received responses from beekeepers in every state.
Months of Preparation
Although the online portal of the Survey is open to beekeepers for the entire month of April, preparation for the Survey starts many months prior. A great example of lead time is demonstrated by this April Bee Culture article. We have to make a February 11th deadline! For many, you’d need a snowmobile or snow shoes to get to your apiary this time of year. The January national bee meetings usually mark the beginning of preparations for the upcoming survey. The rest of January and most of February are dedicated to survey design. The Survey is a collaborative effort between our epidemiologists, economists, and sociologists. We typically revise a draft several times to integrate lessons learned from past surveys in order to improve the flow of the survey. It is a juggling act between clarifying the meaning of questions and keeping them comparable across years. It’s definitely a work in progress! During these months, we also start preparing our promotional efforts. We create advertisements that will run in major beekeeping journals like Bee Culture as well as on our website (https://beeinformed.org/blog/) and Facebook page (https://www.facebook.com/BeeInformedPartnership/). We also have many collaborators who remind beekeepers about the upcoming survey in their extension or outreach presentations. If you too want a personal email reminder, please sign up here: https://beeinformed.org/newsletter/ .
In March, we test, retest, and re-retest the whole survey to ensure that we corrected last minute bugs to the online portal; we also finalize wording of the survey. March is also printing time. Several hundred copies of our paper survey are shipped out to apiary inspectors (so they can distribute them in their states), as well as to participants of other surveillance programs like the USDA National Honey Bee Disease Survey, as well as the Bee Informed Partnership’s Technical Transfer teams (https://beeinformed.org/about/tech-transfer-teams/) and Sentinel Apiary program (https://beeinformed.org/programs/sentinel/).
April 1st is go time; the online portal is open. If you are signed up, we will send you an email with a direct link. We are also very lucky to have a lot of support throughout the industry, so you might receive an invitation from the Apiary Inspectors of America, the American Honey Producers Association, the American Beekeeping Federation, Project Apis m., or maybe even your local and regional beekeeping clubs. Feel free to spread the word too! Throughout April we answer beekeeper questions to the Survey, and start preparing our analyses to be ready for the press release as soon as the survey closes. May 1st is a sprint. As soon as the survey closes, we run the numbers to use in the press release that is shared with media and our many stakeholders. Anyone can read the press release here: https://beeinformed.org/results-categories/colony-loss/. Even previous year’s press releases are up there. Some paper surveys might still arrive throughout May, so those listed in the press release are not our definitive numbers, but they are close to it. Into May and early June, many hands help us enter all the paper surveys that were mailed to us (Figure 1). At the end of June, we analyze the data one last time and produce an updated state-specific map of colony mortality (https://bip2.beeinformed.org/loss-map/). From there, our dedicated graduate students start preparing peer-reviewed publications for one of the honey bee research journals. This on its own take several months of analyses, writing, editing, and reviewing!
All in all, the survey is a complex machine that wouldn’t happen without the dedication of many individuals, all of whom we greatly appreciate.
Baseline data, and so much more!
The Bee Informed Partnership’s Survey represents the most comprehensive honey bee colony health survey data in the country, and quite possibly the world! You heard us. The world, and we’re very proud of it! It’s a powerful tool to estimate honey bee colony mortality, and it provides insight into how important factors like management practices and socio-economics affect our industry. Beekeepers are not the only ones interested in data generated by the Survey. Growers of bee-dependent crops like almonds check the numbers, so to do government officials at the USDA, crop insurers, policy makers, and even the general public. Each May, journalists from around the country inundate us with questions for their news articles aimed at educating the public. Researchers too are keen on the Survey results. Years of data collection are just now allowing data scientists to investigate trends of how beekeeping management influences colony health.
Ultimately, the Survey data are for you, the beekeepers. In fact, any beekeeper with access to the internet can see its data by going to https://bip2.beeinformed.org/ (Figure 2). There you can customize which data you want to see! For example, the default page to the ‘National Management Survey’ reveals information concerning ‘Loss by Operation Size’ under the ‘Overall Loss’ header on the upper left (Figure 3). If you select this feature, and scroll down the page you can see that for all states and all years, Backyard Beekeepers experienced an average winter loss of 41.4%, whereas Commercial Beekeepers lost on average 28.3%. This clearly shows that losses differ by beekeeping type. If you are interested to compare colony mortality between beekeeping using a known Varroa mite control product or not, simply click on the left menu ‘Used Varroa Treatment’ under the ‘Varroa’ header. There you’ll see that over the course of the surveys, that US beekeepers using a Varroa treatment experienced an average winter mortality of 35.4% compared to 43.9% for those that did not. We work really hard to share the data that you all contributed to in a visually compelling way.
So there you have it, some Truths to the Bee Informed Partnership’s Annual Colony Loss and Management Survey. Truth is, it is a powerful tool for understanding honey bee colony mortality in the US. The more beekeepers that participate, the more powerful it will be. So please, consider this a personal invitation to take the survey this April! If you want to see what questions you will be asked before you officially dive in, don’t fear, there is even a ‘Preview’ link to ensure you will be fully prepped when it comes time for the real deal. If you include your email, you’ll also receive a copy of your answers for your records!
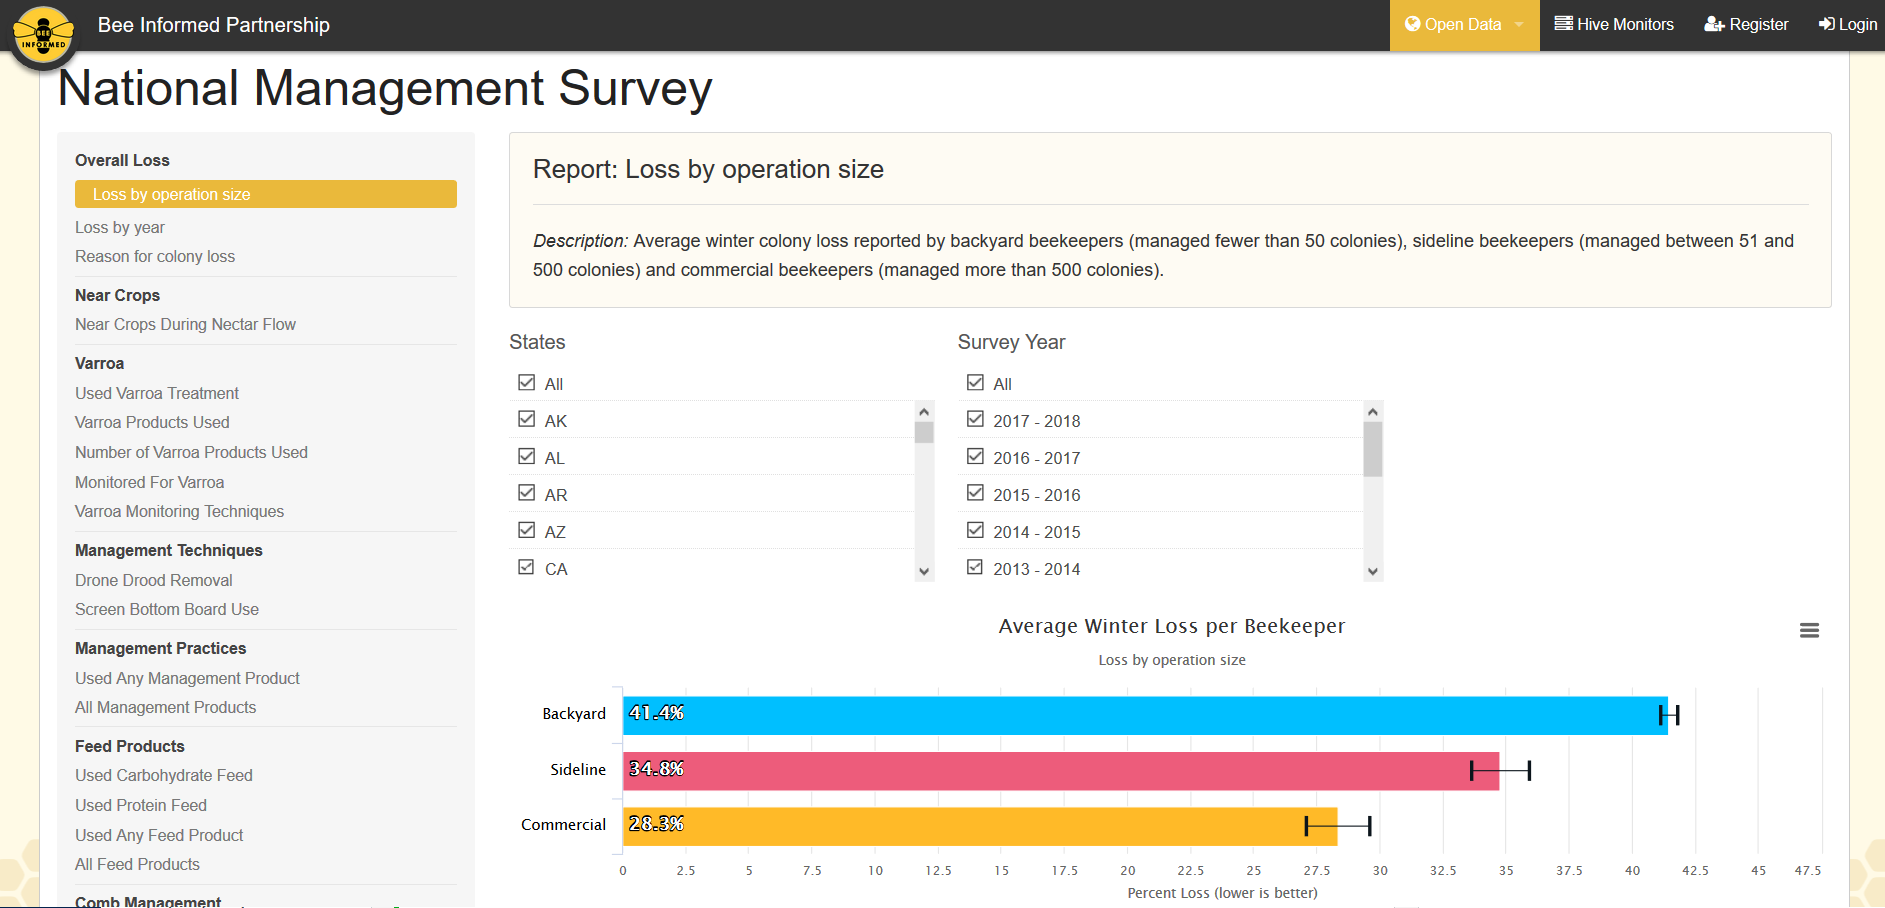
Figure 3. Screenshot of the Bee Informed Partnership’s Research Portal – National Management Survey page. By selecting links on the left menu (e.g. Varroa – Used Varroa Treatment), one can explore the Survey data in depth (e.g. by state and year). The website address is https://bip2.beeinformed.org/survey/.