


Using Remote Hive Monitoring Data
By: Huw Evans
The Benefits of Electronic Data Collection
When compared with manual collection, electronic hive monitoring offers scientists a less intrusive means of collecting more objective data at much higher resolutions, several times per minute if required. Multiple parameters can be simultaneously measured and recorded. The measurements are more consistent as probe positions and settling times do not vary. Remote monitoring simplifies data management; the data is automatically collected and stored in a database saving a huge amount of work while minimizing any potential ‘mix ups’. The data can be graphed from within or downloaded from a single user interface accessed from any Internet enabled device. Which measurements are taken and how often can be configured remotely from anywhere in the world with Internet connectivity. The same user interface allows beekeepers to enter inspection data such as hive manipulations, diseases, Varroa counts and treatments.
Bees do Nothing Invariably
One of the issues facing scientists researching bee health is that “bees do nothing invariably”, as we say in the UK or “bees, its like herding cats” as is more commonly used in the U.S. That’s certainly the case with my bees. On good years I think I’m a great beekeeper, on bad years I think I must have done something horribly wrong. The truth is despite doing the same thing every year I get very different results. OK, I’m not saying that there is not a correlation between how well you look after your bees and how well the bees do, but the health of my bees is a multi factorial thing and I’m only one of those factors. Our suggested approach to this problem is ‘Big Data’ supplied by thousands of monitors. Not only does the sheer amount of data provide buffers to variance, (or buffers to deviations encountered on smaller scale data samples) it can also reveal trends when correlating bee health geographically with potential environmental stressors and different beekeeping practices.
Environmental Effects
Agricultural practices, be it the use of Plant Protection Products (PPPs) or the landscape picture being dominated by vast monocultures, have been implicated as one of the major causes of pollinator decline. Effects of different PPPs, presence of wildflower margins or the proximity to wooded area could all be considered statistically on a wide scale. Similarly, correlations could be drawn with different habitats, urban or rural, managed and unmanaged. The data could also be used to identify trends between bee health and the proximity of things like electric power lines, mobile phone masts, wind farms, electric trains or even motorways.
A recent study at Southampton University has shown that diesel exhaust, in particularly nitrous oxide, rapidly degrades floral odours used by honey bees for the recognition of floral nectar sources such as Canola (Oil Seed Rape). This could have a negative impact upon a honey bee’s foraging efficiency and the pollination services that the bees provide.
Beekeeper practices
Beekeepers ultimately have bees’ interest at heart but making correct management decisions is not always straightforward. There are no hard and fast rules, there are recommendations but experience shows quite different results. Varroa treatment is an obvious example, do different treatments disrupt normal colony behaviour and if so how badly?
What effect does breaking the brood cycle have on long term survival? Does queen age affect colony’s future prospects? What type and amount of supplemental feed should the beekeeper provide? There is plenty of circumstantial evidence but surely a large mass of data collected over long periods of time over a wide geographical area will identify real trends and help clarify these and many other bee husbandry issues.
Suitability of Bee Breed
One species of honey bee, Apis mellifera, has evolved to survive in widely varied environments and climates, which has through the course of evolution led to the emergence of a number of locally adapted subspecies. However, man has moved bees about the planet without giving much thought to the consequences. Most of us believe that local bees do better than the imported bees, but still there are plenty of queens and packages of bees being shipped around the world. Others argue for greater genetic diversity. Trending the performance of different subspecies in different climatic conditions could provide the necessary empirical evidence to help better understand bee breed suitability or even to be used for legislative purposes.
Queen Health
In recent years there has been a lot of debate regarding factors effecting queen health and fitness. As shown in the previous article, instability in brood temperature data can reveal when a queen fails or stops laying. The benefits of being able to trend queen failure geographically are obvious as we would know with considerably better precision when, where and in what order queens were failing. However, in a similar but opposite way, monitor data can also show when queens start laying, which in turn gives us a pretty accurate idea when they mated. For most beekeepers this is currently a bit of a guess as we are trained to leave virgin queens undisturbed for several weeks to mate. Bad weather at the time of mating has been implicated as a potential cause of drone laying queens. Our system also records weather conditions that can be correlated with mating times, even retrospectively.
Hive type
 A myriad of hive types exist and new ones are being developed continuously using new materials and technologies which can effect, for example, thermal insulation and humidity. Wide scale mapping of, for instance, hive humidity levels against hive type in different climatic conditions may help recommendations to beekeepers for more efficient housing of their bees.
Daily flight profiles
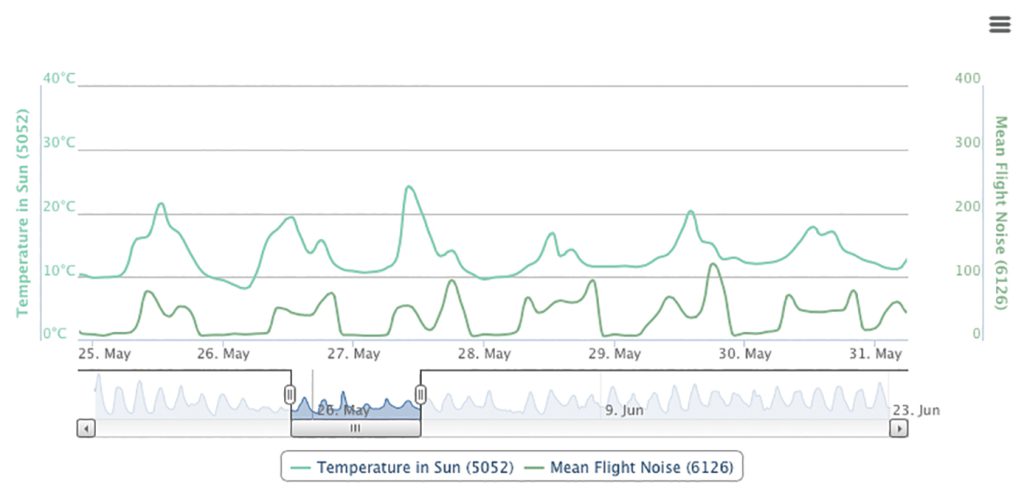
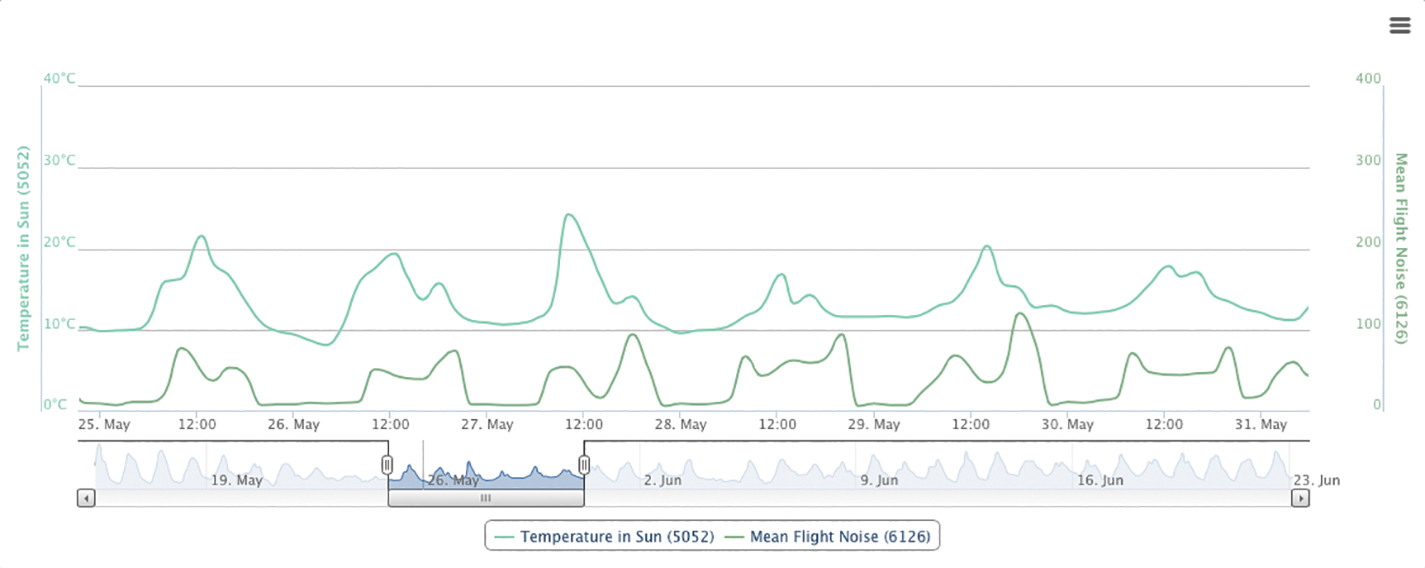
The importance of taking measurements regularly and simultaneously should not be underestimated. Using acoustics, we can economically plot daily flight profiles on a scale and at resolutions that would be practically impossible by human observation as flight profiles vary widely throughout the day. An example of this is shown in fig 1 where we can see that following a flurry of flight activity in the morning there is a lull in activity around lunch time. There is then a second wave of flight activity in the afternoon, which could well consist of foragers, young bees learning to fly in groups or even bees preparing to accompany the queen on mating flights. The ‘character’ of the flight profile therefore changes throughout the season.
Statistical consideration of daily flight profiles could provide a valuable insight into colony behaviour and potentially identify quite subtle trends in relation to exogenous and endogenous factors. Not only could the profile be correlated with other parameters such as what temperature they get going in the morning or how willing they are to fly in light rain, but also how this behaviour may be influenced by other environmental factors such as exposure to PPP’s or in-hive treatments.
Furthermore, an observer moving from one hive to the next throughout the course of the day could mistake a moment of inactivity for an inactive colony; a colony strength assessment would be perverted in a similar way. Therefore, simultaneous data collection is the only way to objectively compare different scenarios.
Forage Efficiency
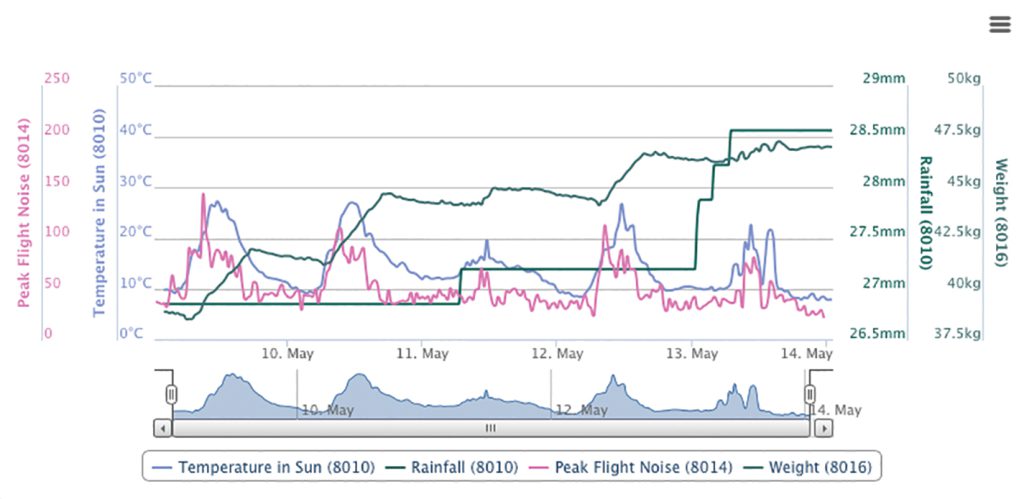
 Weight of the hive is a pretty clear indicator of that colony’s productivity, both in terms of colony size and stores. Typically, the slope of the weight increase is proportional to the abundance of and the distance to the forage source. This information becomes more valuable when combined with measurements such as flight activity and meteorological data, as seen in fig 2.
The amount of flying necessary to bring in a certain amount of nectar can be considered a measure of ‘forage efficiency’. Typically, flight activity is proportional to the net weight increase, however we can see that following morning rain, despite an increase in flight activity, there is little nectar brought in. Fanning activity can be added to indicate nectar processing, showing when it takes place and to what relative degree. Like the daily flight profile, this gives us further insight into bee behaviour and even potentially useful circadian rhythm information.
Moreover, tracking weight over longer periods also offers insights into the occurrence and availability of forage. Hive weights were used by Dr Wayne Esaias to draw up maps of flowering vegetation, which in turn have shown the effect of urban warming on the timing of flowering. When there is dearth, the resulting drop in weight is a useful indication of the colony’s metabolism, in other words, how much energy the colony requires when there are no external sources of nectar are available.
Black Box
Electronic hive monitoring can also help explain sudden and unexpected colony loss. When a plane crashes, all flight data preceding the crash is saved on a flight recorder or ‘black box’. A lack of ‘black box’ data often makes it difficult for scientists to establish the cause of colony collapse. In the last article we demonstrated that by considering a sudden drop in weight with a sharp increase in flight activity successfully diagnosed robbing as the cause of a colony’s failure.
 Recently a beekeeper was transporting bees a relatively short distance, on arrival the weather was bad so he returned 24hrs later to open the colonies and discovered one of the hives was full of dead bees. Luckily that colony was being monitored, so we had a look to see if we could work out what had gone wrong. From Fig 3 we can see the day started with a nice healthy colony with a stable brood temperature. There was then a sudden increase as the brood temperature rose sharply to 46°C. Initially we suspected some kind of hornet attack, however using acoustics we were able to include fanning activity at which point the cause became obvious.
It was a warm day and the bees could have done with a little bit more ventilation. As they began to warm up, they began to fan which generated more heat and this positive feedback cycle lead to self-destruction. From that point on the brood temperature follows ambient temperature with a small lag as the temperature sensor is inside the hive. Using the monitor data we could pinpoint both cause and time of death, without this data we would still be guessing what had gone wrong. This is indeed a tragic tale, however it did furnish us with a new ‘overheating when being transported’ alarm feature.
Conclusion
It is not the intention of this article to be prescriptive about how the data may be useful to a scientist. However, the benefits of wide scale data collection with its ability to deal with variability and trend bee health appear obvious.
When compared to taking measurements manually, electronic monitoring offers less intrusive and simultaneous data collection at much higher resolutions. Sceptics may fear that relatively uncontrolled data may lack ‘quality’. However, this is where we can turn to ‘crowd’ or ‘collective wisdom’.
This data has benefits beyond bee health, “If the world is our coal mine then bees are our canaries”. Bees can be considered an indicator species, with a forage range of 10km2 they make perfect bio sentinels. A lot of good science has already used bees’ data to help to map air pollution, toxins in the environment and even global warming.
So how do you persuade thousands of beekeepers to start strapping hive tech to their hives? You simply offer them a useful beekeeping tool! arnia’s monitoring system brings benefits directly to the beekeeper which both aids recruitment and maintains beekeeper participation in wide scale long term field trials.
Large scale data collection is underway in the U.S. under the auspices of the Bee Informed Partnership. Arnia is one of the registered suppliers of equipment for this project.
As with the application of electronic monitoring to bee husbandry, the true value ‘big bee data’ can bring to scientists will continue to evolve over time.
Huw Evans is the co-founder of arnia, a research and development company that designs and builds hive monitoring equipment. arnia hive monitors are currently for sale in the U.S., for more information contact sales@arnia.co.uk.

