

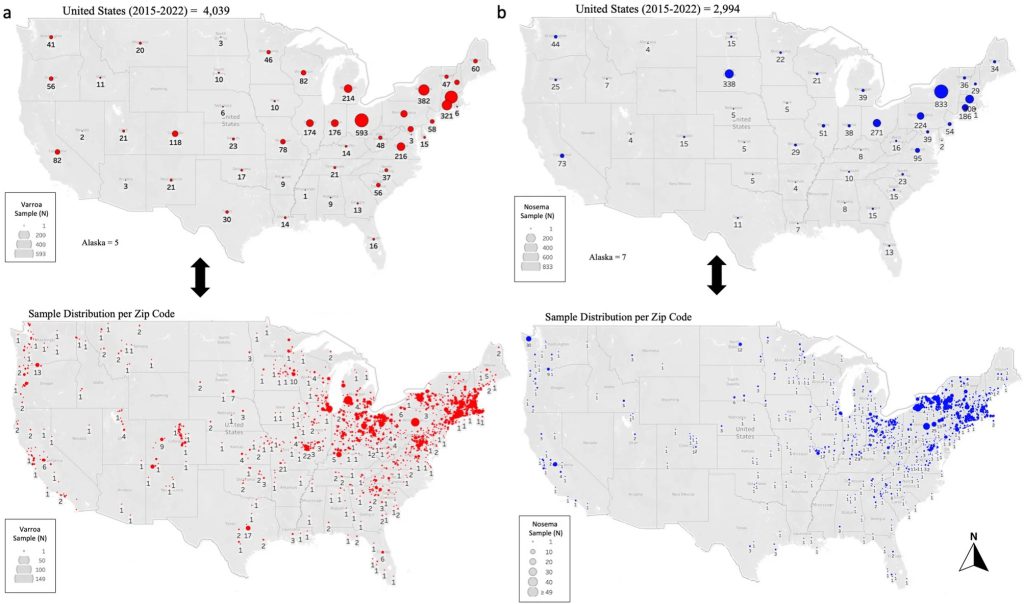
Overall number and distribution of analyzed samples from 2015 to 2022 across the U.S., displayed per state and county Zip code. (a) Samples analyzed for Varroa mite per 100 bees and (b) Nosema spore count per bee. Overlapping samples in the Zip code maps were omitted for better visualization of the sample distribution.
Prevalence and distribution of Varroa destructor and Nosema spp. in symptomatic honey bee colonies across the USA from 2015 to 2022
We are here to share current happenings in the bee industry. Bee Culture gathers and shares articles published by outside sources. For more information about this specific article, please visit the original publish source: Prevalence and distribution of Varroa destructor and Nosema spp. in symptomatic honey bee colonies across the USA from 2015 to 2022 | Scientific Reports (nature.com)
- Samuel Abban,
- Bart Smith,
- Miguel Corona,
- Steven C. Cook,
- Jay D. Evans,
- Yanping Chen &
- Mohamed Alburaki
Scientific Reports volume 14, Article number: 1726 (2024)
Abstract
USDA-ARS Bee Research Laboratory received symptomatic honey bee (Apis mellifera L.) samples across the United States for disease diagnosis. Here, we present a retrospective study and cartography of ectoparasite Varroa destructor and intracellular microsporidia parasite Nosema spp. These two major parasites were identified in the diseased honey bee samples between 2015 and 2022. Varroa infestation level (VIL) was examined by a wash technique (Mites/100 bees) and calculated as a percentage, while Nosema infection was quantified by microscopical spore count (Million Spores/Bee). Data were analyzed by month, year, state, and by nine geographical climate regions described in the U.S. Of adult bee samples (n = 4039) that were analyzed for Varroa mite infestation, the overall VIL in the U.S. ranged between 0.4 and 30.85%, with an overall national VIL and Varroa prevalence of 8.21% and 85.14%, respectively. Overall monthly data showed VIL constantly exceeded the critical level of 4% except from June to September and reached a maximum of 15% in January and December. Nationwide, VIL significantly (p < 0.001) increased from 2015 to 2018 (1.1–4.7%), plateaued from 2018 to 2021 (4.7–4.5%), followed by a significant decrease in 2022 (3.6%). Significant VIL differences (p < 0.001) were recorded among climate regions, with the highest mite infestation levels in the Upper Midwest region (13.9%) and the lowest in the West region (5.1%). Of adult bee samples (n = 2,994) that were analyzed for Nosema infection, Nosema spore count ranged between (1–16.8) million spores per bee among states, with a national average of 6.8 and a prevalence of 99.7%. The lowest and highest Nosema loads were respectively recorded in the South region (3.1) and Upper Midwest (10.5), a significant difference (p < 0.001). No statistical differences were recorded among the six other climate regions. Overall, VIL and Nosema infection correlated significantly (p < 0.001) with a regression coefficient of (R2 = 0.6). Our data, which originated from ailing bee colonies, showed significantly higher rates of maladies compared to data from healthy colonies obtained by the USDA-APHIS National Honey Bee Survey, demonstrating the role of bee diseases caused by Varroa mite and Nosema in honey bee population declines.