


Emergency assistance to honeybee producers averaged $45 million annually from 2020–22
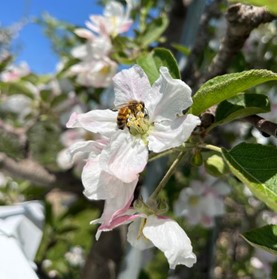
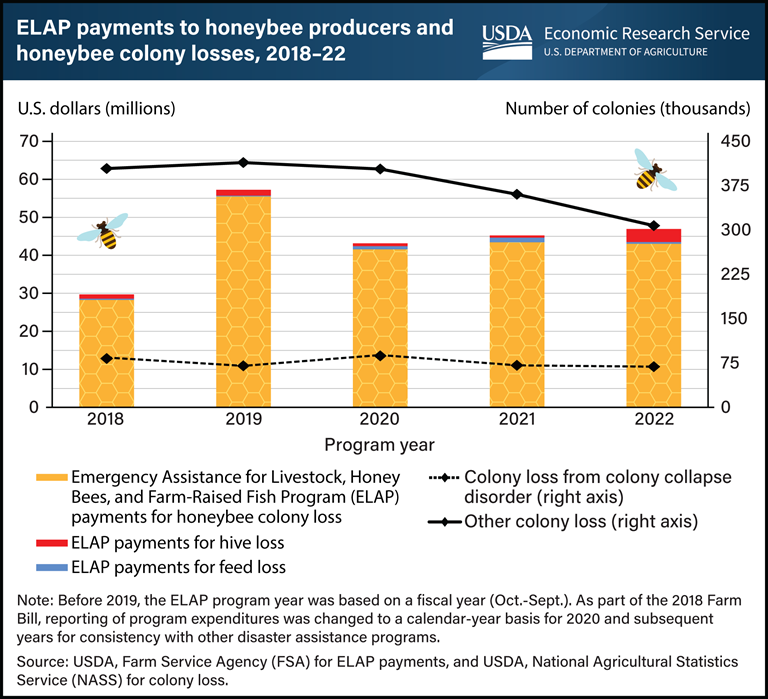 Honeybee health and honey production are impacted by extreme weather events. In recent years, droughts in the western and northern Great Plains regions have decreased floral resources on which commercial honeybees typically forage. Elsewhere, hurricanes and heavy rains in some southern States damaged and destroyed forage, in some cases even drowning hives. Eligible U.S. honeybee producers who incur colony, hive, and feed losses as a direct result of a qualified adverse weather or loss condition have access to payments made through the USDA’s Emergency Assistance for Livestock, Honey Bees, and Farm-Raised Fish Program (ELAP). Payments under ELAP for honeybee losses totaled $30 million in 2018 and rose to $57 million in 2019. Between 2020 and 2022, payments averaged $45 million annually. Over the last 5 years, 95 percent of the assistance was for colony losses, followed by hive losses (3 percent), and feed losses (1 percent). A colony usually refers to the family unit of the bees, including a queen, workers, and drones, whereas a hive refers to the physical structure in which the colony lives. Payments spiked in 2019 coinciding with a 2-year period characterized by an increased number of colony losses caused by extreme weather events, pests, and diseases. After losses related to these factors spiked at 300,000 colonies in 2022, colony losses have started to decline but remain elevated compared with 5 years before. At the same time, losses related to colony collapse disorder—the sudden die-off of honeybee colonies—have been relatively stable since 2015, averaging about 72,000 colonies per year, but persist as a challenge to U.S. honeybee producers. This chart is drawn from USDA, Economic Research Service’s Sugar and Sweeteners Outlook published in June 2023.
We are here to share current happenings in the bee industry. Bee Culture gathers and shares articles published by outside sources. For more information about this specific article, please visit the original publish source: USDA ERS – Chart Detail