


Kim Flottum
By: Kim Flottum
2018 USDA NASS Colonies Report
This is the third year this report has been published, beginning in 2015. Below is the summary from USDA NASS surveyers on their report, which refers to all the data they collected on numbers, stressors, more than and fewer than five colony beekeepers, losses, revonated colonies and the rest. You can find the complete report on the USDA NASS web page.

From The Report – January 1 Honey Bee Colonies Down Slightly for Operations with Five or More Colonies
Honey bee colonies for operations with five or more colonies in the United States on January 1, 2018 totaled 2.63 million colonies, down slightly from January 1, 2017. The number of colonies in the United States on April 1, 2018 was 2.69 million colonies. During 2017, honey bee colonies on January 1, April 1, July 1, and October 1 were 2.64 million, 2.69 million, 2.99 million, and 2.85 million colonies, respectively.
Honey bee colonies lost for operations with five or more colonies from January through March 2018, was 425 thousand colonies, or 16 percent. The number of colonies lost during the quarter of April through June 2018 was 270 thousand colonies, or 10 percent. During the quarter of October through December 2017, colonies lost totaled 425 thousand colonies, or 15 percent, the highest of any quarter in 2017. The quarter in 2017 with the lowest number of colonies lost was April through June, with 286 thousand colonies lost, or 11 percent.
Honey bee colonies added for operations with five or more colonies from January through March 2018 was 513 thousand colonies. The number of colonies added during the quarter of April through June 2018 was 726 thousand. During the quarter of April through June 2017, 613 thousand colonies were added, the highest number of honey bee colonies added for any quarter of 2017. The quarter of October through December 2017 added 205 thousand colonies, the least number of honey bee colonies added for any quarter of 2017.
Honey bee colonies renovated for operations with five or more colonies from January through March 2018 was 289 thousand colonies, or 11 percent. During the quarter of April through June 2018, 715 thousand colonies, or 27 percent, were renovated. The quarter in 2017 with the highest number of colonies renovated was April through June with 763 thousand colonies renovated, or 28 percent. The quarter in 2017 with the lowest number of colonies renovated was October through December 2017, with 214 thousand or eight percent. Renovated colonies are those that were requeened or received new honey bees through a nuc or package.
Varroa Mites Top Colony Stressor for Operations with Five or More Colonies
Varroa mites were the number one stressor for operations with five or more colonies during all quarters of 2017. The quarter of October through December 2017 had the highest percentage of colonies reported to be affected by Varroa mites at 55.3 percent. The percent of colonies reported to be affected by Varroa mites during January through March 2018 and April through June 2018 are 40.8 percent and 53.4 percent, respectively.
Colonies Lost with Colony Collapse Disorder Symptoms Up 15 Percent for Operations with Five or More Colonies
Honey bee colonies lost with Colony Collapse Disorder symptoms on operations with five or more colonies was 77.8 thousand colonies from January through March 2018. This is a 15 percent increase from the same quarter of 2017. Colonies lost with Colony Collapse Disorder symptoms were reported to meet all of the following criteria: 1) Little to no build-up of dead bees in the hive or at the hive entrance 2) Rapid loss of adult honey bee population despite the presence of queen, capped brood, and food reserves 3) Absence or delayed robbing of the food reserves 4) Loss not attributable to Varroa or nosema loads.
January 1 Honey Bee Colonies Down Nine Percent for Operations with Less than Five Colonies
Honey bee colonies for operations with less than five colonies in the United States on January 1, 2017 totaled 40.0 thousand down nine percent from January 1, 2016. During 2017, honey bee colonies on April 1, July 1, and October 1 were 35.0 thousand, 43.0 thousand, and 39.0 thousand, respectively.
Honey bee colonies lost for operations with less than five colonies during the quarter of January through March 2017 was 13.5 thousand colonies, the highest number of honey bee colonies lost during any quarter for 2017. The quarter in 2017 with the least number of colonies lost was April through June, with 4.20 thousand colonies.
Honey bee colonies added for operations with less than five colonies during the quarter of April through June 2017 was 12.5 thousand colonies, the highest number of honey bee colonies added during any quarter of 2017. The quarter in 2017 with the least number of colonies added was October through December, with 960 colonies.
Honey bee colonies renovated for operations with less than five colonies during the quarter of April through June 2017 was 4.40 thousand colonies, the highest number of honey bee colonies renovated during any quarter of 2017. The quarter in 2017 with the least number of colonies renovated was October through December, with 1.10 thousand colonies.
Varroa Mites Top Colony Stressor for Operations with Less than Five Colonies
During 2017, the highest reported colony stressor was Varroa mites, with 26.3 percent of the colonies reported to be affected. This is a five percent increase from the previous year.
Colonies Lost with Colony Collapse Disorder Symptoms for Operations with Less than Five Colonies Up Nine Percent
Honey bee colonies lost with Colony Collapse Disorder symptoms on operations with less than five colonies was 6.00 thousand colonies during 2017, a nine percent increase from 2016. Colonies lost with Colony Collapse Disorder symptoms were reported to meet all of the following criteria: 1) Little to no build-up of dead bees in the hive or at the hive entrance 2) Rapid loss of adult honey bee population despite the presence of queen, capped brood, and food reserves 3) Absence or delayed robbing of the food reserves 4) Loss not attributable to varroa or nosema loads.
What Bee Culture has done here is to review side by side comparisons for all three years, looking at colony numbers each quarter in Figure 1. The percent figure to the right of each colony number is the Difference from the average over all the years there is data from for each quarter. For instance, in January 2015 there was 5.4% more colonies than the four year average for January.
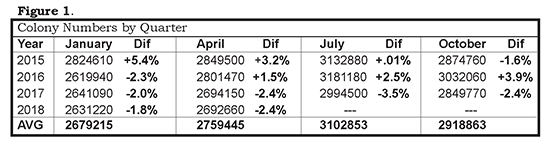
It will be interesting to see how the July and October numbers for 2018 play out. It’s also interesting to note the consistency of colony numbers by quarterly count. The very first count, in January 2015 is barely over 5% above the average of January each year, with the rest showing less than 4% variance for each count. With between 3.7 and 3.1 million colonies, that’s a small difference each season. You can almost, but not quite, tell what month the count was taken by the number of colonies counted. It would seem the beekeeping industry pretty much has how many colonies it needs over the course of a year figured out.
With the focus of keeping bees shifting from producing more honey to producing more bees one wonders if this pattern will shift. And with more almonds coming online every February will the January number shift too? If you depend on the beekeeping industry, following these numbers should be important.
But the importance of honey to commercial, and certainly backyard beekeepers hasn’t disappeared, so we took a look at honey production in light of this quarterly report, and in particular we looked at the top 10 honey producing states during each quarter. These top 10 states, in 2017, produced just over 76% of the U.S. honey crop, so they certainly should be examined. And it should be no surprise that over the course of a year, right about 76% of US colonies reside in these states, at least part of the year. And that’s what makes this an interesting picture to look at. Because there is a seasonal flow of colonies in these states you can see when the honey producing season is in each of these states.

The data in Figure 3 is taken from the May, 2018 issue of Bee Culture showing the top 10 honey producing states for the past seven years, how many colonies each had at the Annual January 1 colony count, and how much honey was produced in each state each year. Note that these 10 states, each year, produce three quarters of the honey produced in the U.S. Now, because of the new quarterly reports, we are able to see how colony movement facilitates production, and reacts.
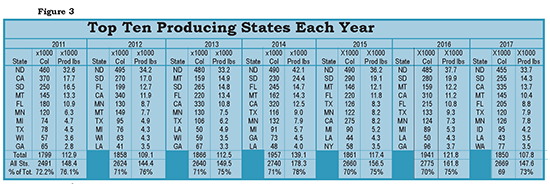
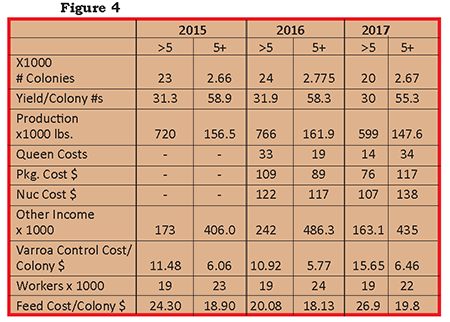
Figure 4 is also taken from the May, 2018 issue of this magazine to review colony counts and other factors affecting beekeepers with fewer than five, and more than five colonies.
Combined, these our figures give a pretty good picture of the U.S. Beekeeping industry. And with this quarterly report the picture is getting clearer and better defined over time. After talking to several migratory commercial beekeepers this picture was pretty much imagined, but now there are better actual numbers. For growers, who have only some of this picture, they now have better prediction tools for next season, looking at what has been, and, pretty much, what will be.
Finally, let’s look at quarterly colony losses between the January – March quarter 2016 and the April – June 2018 Quarter
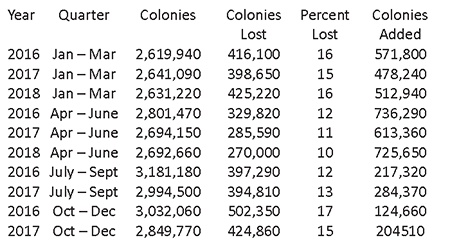
We listed these quarters this way so you can see losses in same quarters for each year, and, the number of colonies used to replace, and even build on the numbers after quarterly losses. It’s clear there are fewer losses between April and September than during the October through March time frame. No surprises here, actually, but you can calculate the costs of replace 10 percent of your colonies comparted to replace 17 percent. A figure not shown here is something called renovated colonies, or those that were lost, but brought back to be useful, splits, swarms and the like. This number across all quarters is roughly half or better than the number of reported lost colonies, so generally at the end of each quarter there are more colonies than at the beginning. What isn’t figured in these numbers is the cost of replacement or renovation. A good example is California in the October – December 2017 quarter. They lost 155,000 colonies, added 90,000 and renovated 104,000 colonies for a net gain of 39,000 to get ready for the Almonds. Still, the question is where are those 20% – 50% losses we hear about every time you read an article in the popular press?