


Thermal Top Bar Hive Beekeeping
by Wyatt Mangum
Top-bar hive beekeeping is a popular and pleasant way to keep bees. There are no heavy honey supers to move, and the hives are at a comfortable working height. Both of those features make the bee work easier on the back. In my apiaries, all my top-bar hives, even my extra long five-foot hives, are mobile, which I routinely move working alone. I rent the hives for $60 per colony for pollination, and recently I published a web page showing Summer honey production data of around 60 pounds per hive (see the links at my webpage at the end of this article).
Top-bar hives are inexpensive to build and require no fancy woodworking tools, except for a table saw to cut the top bars. Usually another beekeeper has one and will cut the top bars for a hive or two, which is easy for those so skilled.
With the availability of thermal cameras in the consumer market, beekeepers have a new tool to assess some colony conditions. Since I come from a physics and mathematics training, for years I have wanted a thermal camera for apiary use. Currently, I am using two Flir thermal cameras. One takes an iphone 5 (32GB), the other an iphone 6 plus (128GB). My iphones are essentially dedicated to their thermal cameras, that is, they do not have active phone numbers, but they can download the needed apps over web connections. The iphones store the thermal images and videos. So I got the maximum memory (32&128 GB), even though the file sizes of thermal images and videos are much smaller than comparable files using visible light.
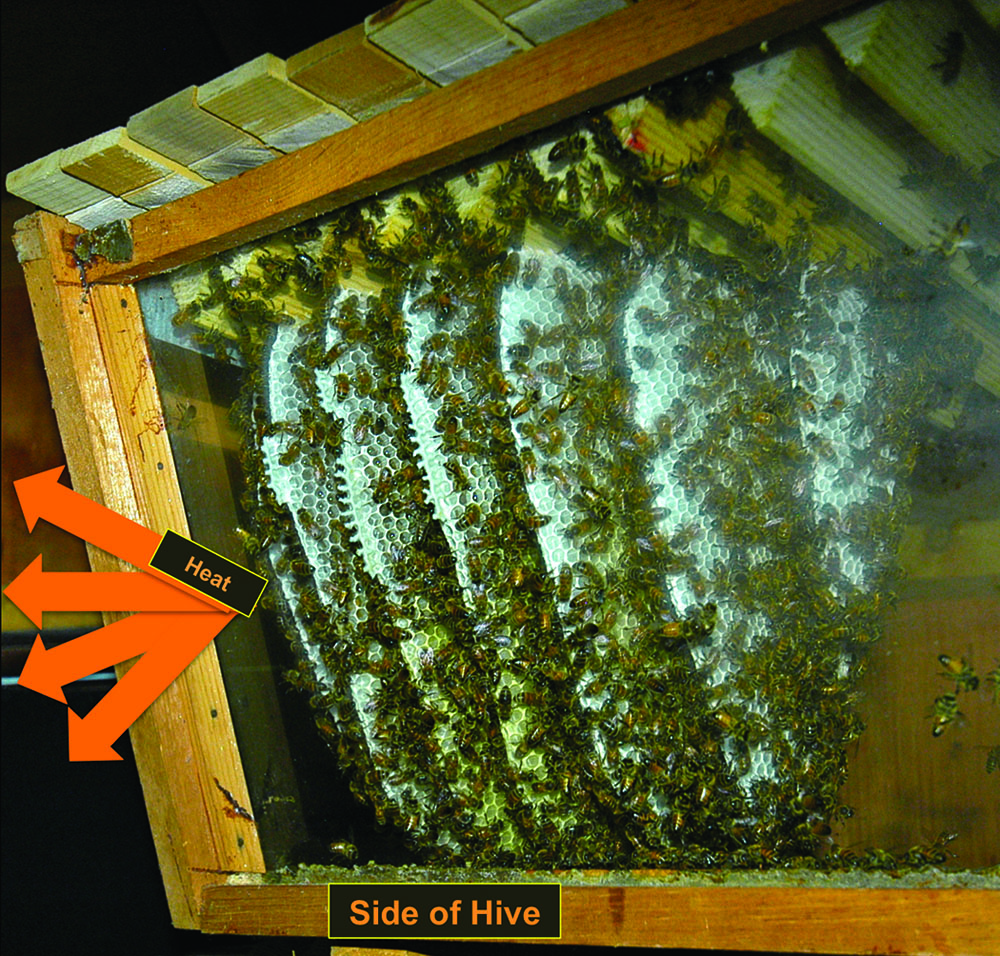
Figure 2 Understanding the comb orientation. From the side of the top-bar hives, you would see the edges of the combs, analogous to looking at a loaf of bread from the side. Like the larger hives in the apiaries, this top-bar observation hive has its combs perpendicular to the glass side of the hive. The heat radiates from the side coming between the combs as shown by the arrows. By “seeing” the heat from the side of the hive, we obtain a view of the colony, so far, mostly from the brood nest, but extending into the honeycombs too.
I have been studying top-bar hive colonies with thermal cameras, in ways analogous to what others may have done with frame hives. For this application, the thermal camera records heat from the colony radiating through the wooden side of the hive (see Figure 2). Unless in the heat of the Summer, the brood nest is usually warmer than the surroundings. Internally, the brood nest is approximately 95˚F (35˚C), but less so on the surface of the side, what the thermal camera sees. It is best not to have sunlight on the side, which would be camera-recorded warmth not produced by the bees and can confuse how to diagnose, or “read” the image. The thermal camera color-codes the different temperatures in one of several color scales chosen by the photographer. Some scale choices are more artistic (see Figure 3) while other scales reveal details about the heat variation radiating from the hive, called the heat signature.
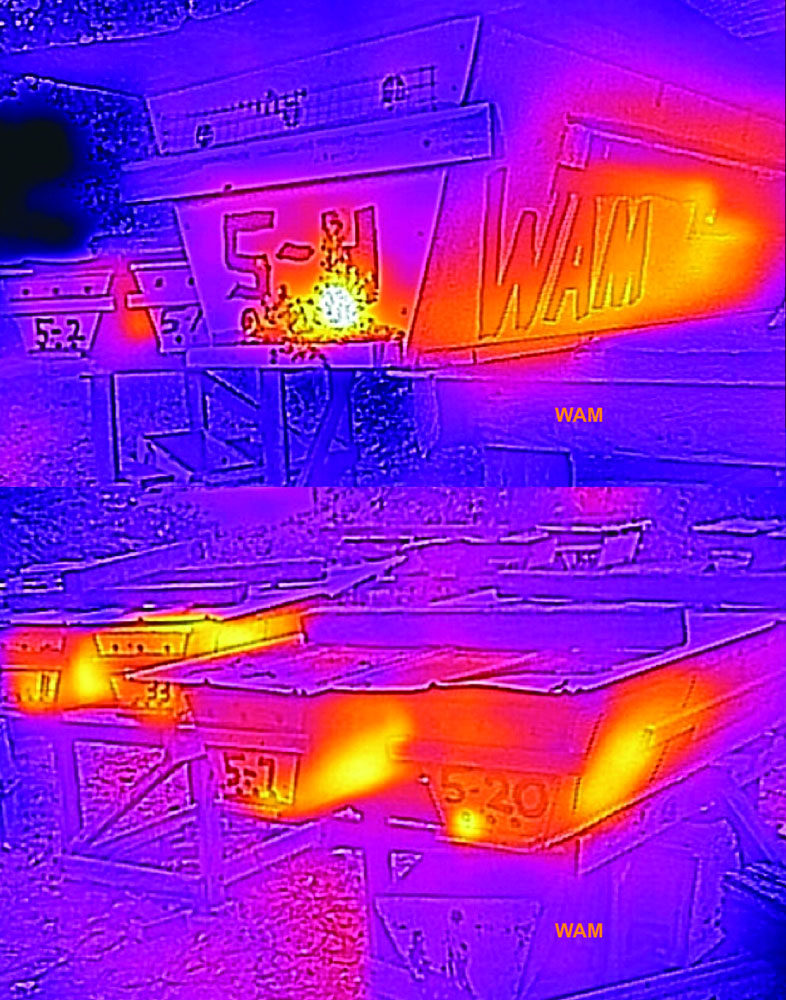
Figure 3 One of my top-bar apiaries shown with an artistic thermal heat scale. The upper picture is a hive close up while the lower one shows an apiary. The glow indicates heat from the hives with brighter meaning hotter. The hot brood nests, located near the entrances, glow the brightest. My entire top-bar operation is mobile. If I lose an apiary location, I move everything quickly. No need for help. That happened last Summer when the loggers came – Poof! That apiary was gone like a ghost!
To obtain baseline heat signatures corresponding to known internal colony conditions, I matched the heat signatures from the side of the top-bar hives to the observed colony conditions within. Figure 4 shows an example where the vertical lines marked on the hive indicated the boundary of the observed brood nest. Internally, the brood nest would be held at a higher temperature. Externally, the warmer part of the heat signature fits within the boundary marks. That was a typical Summer pattern observed in the cool mornings. (In a top-bar hive with the entrances at one end of the hive, the bees locate the brood nest close to that end of the hive. That makes access to the brood nest very efficient, especially in the Spring. In the Summer with limited forage, the brood nest typically became smaller and contracted away from the entrances.)
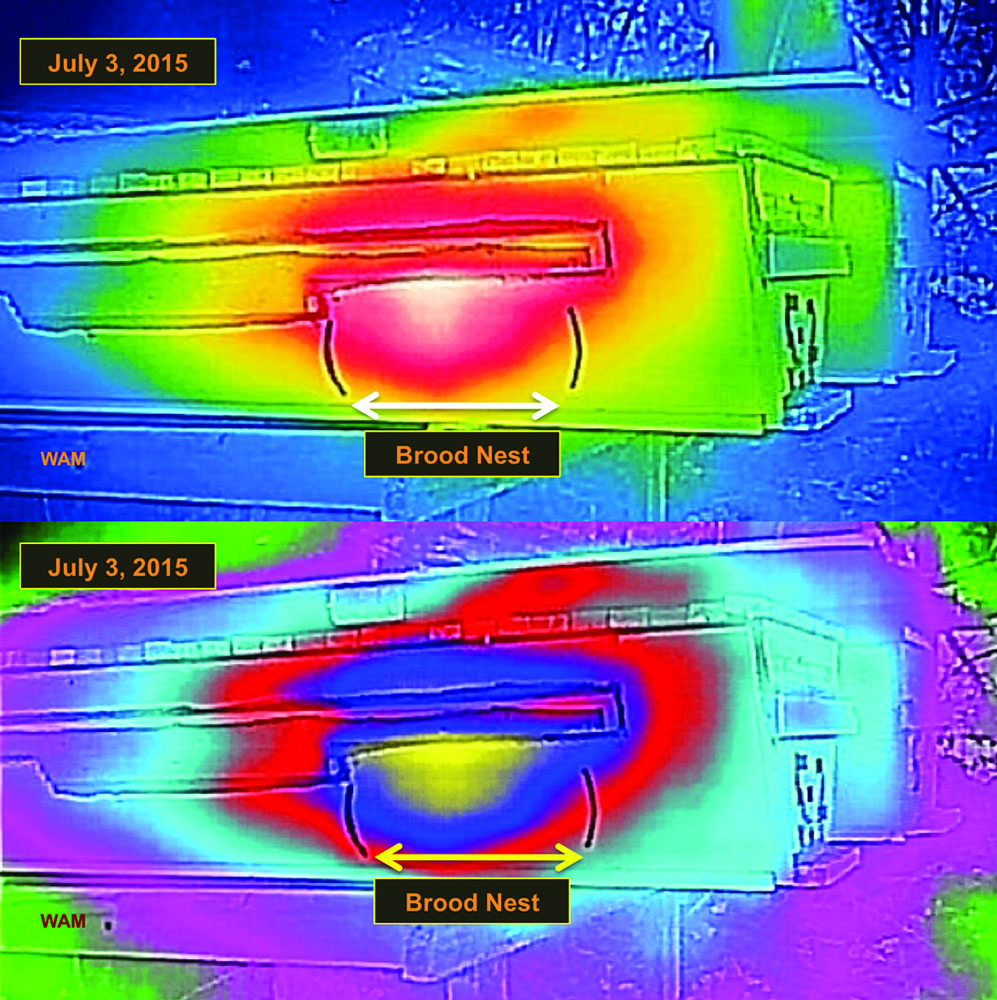
Figure 4 A side view of the same top-bar hive in two heat scales. The hottest color is white (upper) and yellow (lower), and then the colors become cooler the further from the marked brood nest. The thermal heat image of the brood nest matched the physical placement of the observed brood nest between the vertical boundary marks, which did not happen in one case (see below).
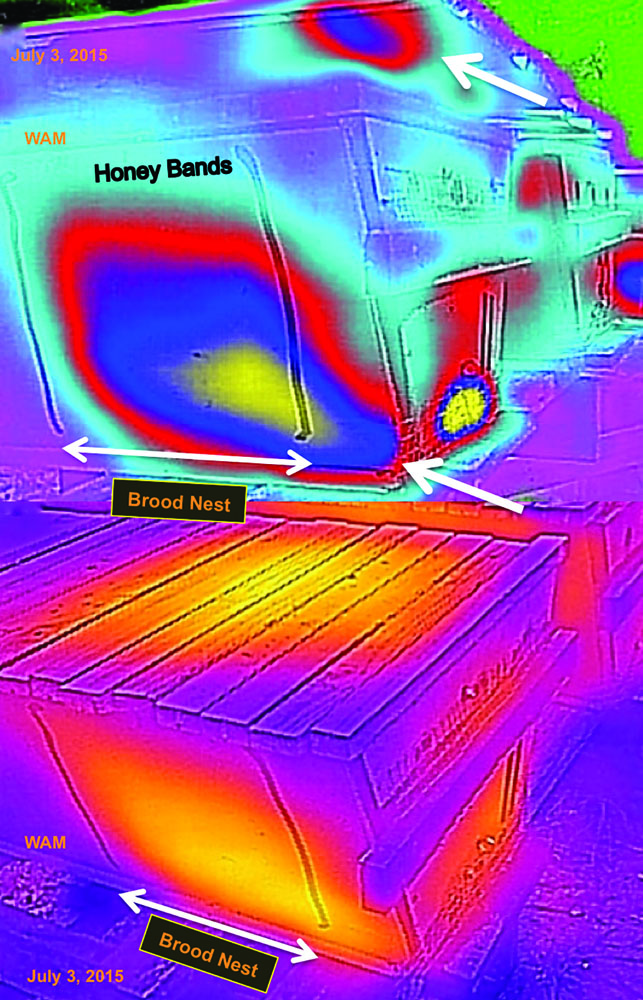
Figure 5 Matching the brood nest to its heat pattern with additional details. The left side of the brood nest abruptly matched the boundary mark because a solid comb of honey stopped the back of the brood nest. On the right side, bee traffic to the entrances formed a warm path, distorting (blue) out of the boundary marker (and to the lower white arrow). The upper white arrow points to heat reflected off the cover. That heat came out of the top of the hive, shown by the glowing top bars in the lower picture.
Figure 5 shows Hive 11, a new colony, in two heat scales. The top image shows the brood nest close to the entrances within the brood nest boundary marks on the hive. Notice the blue heat path leading to the lower entrances (indicated by the lower white arrow at the front of the hive). I took these pictures on a cool Summer morning. From the bee activity they made a warm path to the entrances. At the lower entrances, they appeared hotter (yellow) to the camera because of the direct heat transmission (not through wood as with the brood nest). The upper white arrow, pointing to the metal hive cover, showed a blue hot spot. That is reflected heat from the metal cover, heat coming from the top of the hive. The lower picture shows the heat coming out of the top of the hive, indicated by the glowing top bars, heat originating from the brood nest below.
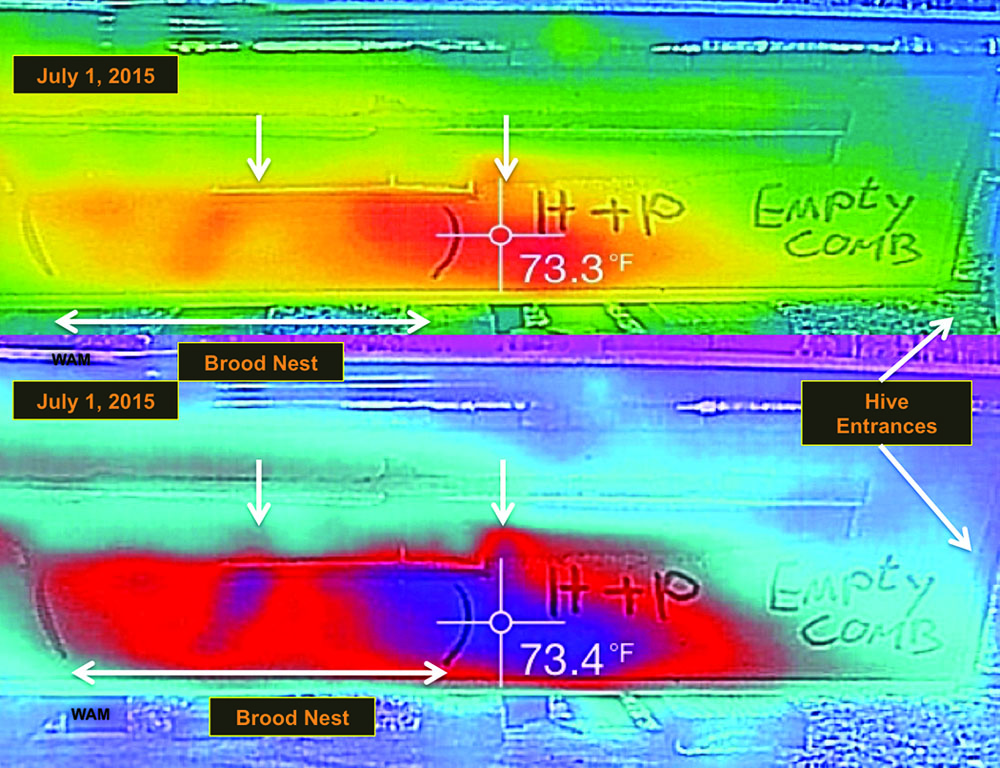
Figure 6 A partial mismatch and no concentric tight bands of cooler temperatures. A side view of a five-foot long hive oriented like Figure 3 with the brood nest marked the same along with the two heat color scales, except above red was the warmest (no white), and below, blue was the warmest (no yellow), perhaps because conditions were not hot enough in the hive. The warmest areas red (above) and blue (below) had shifted into combs marked honey and pollen (H&P). The brood nest pattern appeared normal. The small vertical downward pointing white arrows indicated subtle features in the two heat signatures, best seen in the lower heat scale.
Figure 6 shows a case where the brood nest and the warmest part of the side do not completely match the brood nest boundary marks. The brood nest had contracted far back into the hive in the Summer dearth. The warmest part of the heat signature seemed too far to the right, centered near the camera’s aiming sights, the surface temperature being approximately 73˚F (22.8˚C). Inside, the brood nest pattern appeared normal. But the heat shift to the right was curious. With the entrances on one end on the hive, typically more bee activity occurs in that direction. On the entrance side near the brood nest, combs typically become empty from brood nest contraction, but still retain honey and pollen bands above, so I marked them H&P on the hive. Further from the brood nest, the empty combs were near the entrances. This organization is normal for queen stock with proper local season sense in a Summer dearth.
However, it seemed like the colony was not heating its observed brood nest consistently, the area between the boundary marks. Some heat scales reveal slight variations in the heat signatures, which might have a bearing on the thermal biology within the hive. In the lower scale of Figure 6, a warmer blue bubble appeared in the middle of the (possibly) under-heated brood nest. Strangely in the upper scale, the warmer red bubble barely appeared. Colony cases like this one need more study. Nevertheless as of January 2016, the colony had a heat signature with the cluster just within the right boundary marker with a cluster size consistent with other “normal” Winter colonies.
In the Summer, if a colony had a greatly diffuse heat signature, then I suspected some difficulty was occurring in the hive. I have only used this thermal camera for one Summer with limited observations so I do not yet know how reliable this procedure is. With that in mind, here is a case in the upper picture of Figure 7. The diffuse warm blue pattern extended all the way to the entrances. I knew this colony had failed to requeen itself following Spring swarming from all the recently vacated swarm queen cells. I let it remain queenless until its brood combs showed eggs of numerous laying workers (many eggs per cell). The colony population was still surprisingly strong with plenty of guard bees and crowded forager traffic for July. From the outside, it would not have been among the high-priority hives to inspect if working with limited time in colony triage mode. Colonies in this condition are cryptic and time-consuming to find by slow inspection. Hopefully the thermal camera can rapidly and reliably detect them before pest problems occur.
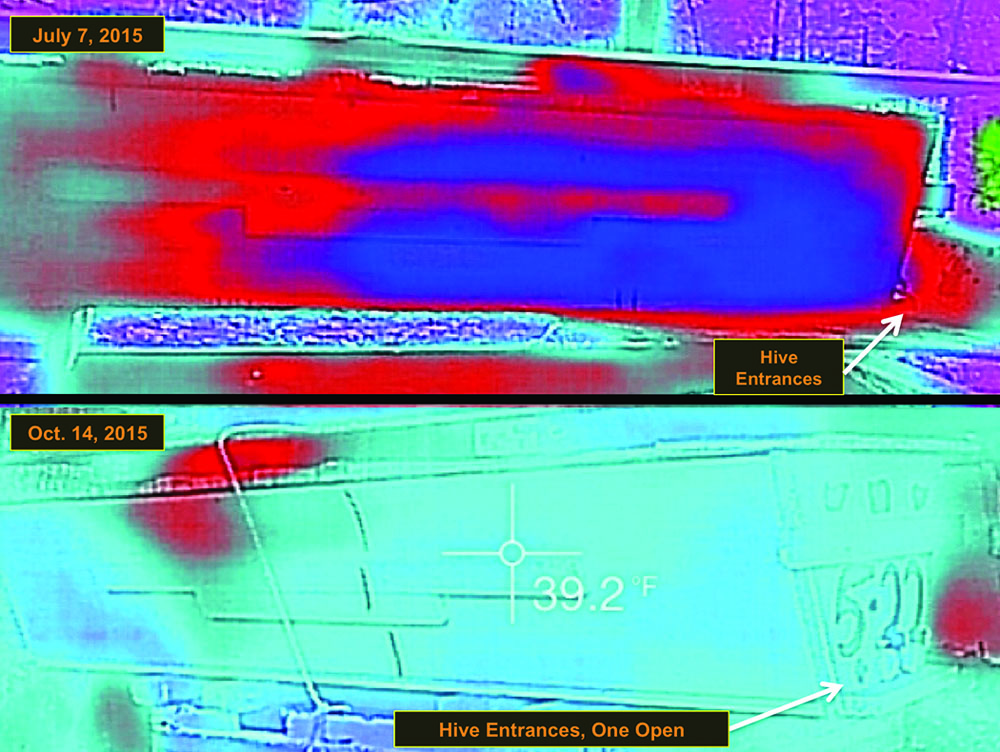
Figure 7 (upper hive) A diffuse heat signature from a temporarily strong colony with laying worker eggs scattered in the front half of the hive. Soon in the Summer heat, small hive beetles will conquer the colony, sending its combs to slime and ruin. (lower hive) The heat signature of a small colony in the Fall. I knew the colony was nonviable because I had seen its laying workers. I am expecting to see this kind of heat signature of nonviable colonies in late Winter and early Spring. Hopefully, not too many.
The lower picture of Figure 7 shows a small heat signature, just in cool red area near the back of a five-foot long hive. In the Summer, this marginal colony went queenless. As the colony became weaker, not able to cover its combs with bees, I removed them, saving the combs from small hive beetles and wax moths. I replaced those top bar combs with pieces of plywood towards the front of the hive. I also plugged five of the six entrance holes with scrap sponges (my entrance reducers), protecting the small colony from robbing. I wanted a heat signature of a very weak colony for educational use. In this case, the colony had laying workers, but was still alive on a cold day (39˚F, 3.9˚C) in October 2015.
The thermal cameras need not detect heat from just bee clusters. For example, I increase my colony numbers and find potential survivor stock by catching swarms in numerous bait hives spread out in three counties. Last Spring I caught 17 big swarms, or 30% of bait hive occupancy. That was a typical season and a very economical increase of colonies when package bee prices have shot up over $100. I do not use scent lures, never touch a ladder, and have no complicated rope pulleys to hoist hives way up in a tree. I cannot do any of that when putting out around 50 bait hives. Rather, I use empty comb to get the scouts to build early consensus to accept my bait hives. At the end of swarm season, I need to gather up my empty bait hives, remove their empty combs (two per hive), and fill other top bar hives with them for storage under fumigation for wax moth control. (I also do open air comb storage too, without chemicals, but right now that capacity is limited.)
The upper picture in Figure 8 shows a pile of two-foot long top-bar hives full of empty comb only, no bees, ready to be transported to a sealed and locked storage container for fumigation. In the Spring, empty combs in the bait hive do not have wax moth problems, too early in the season. After swarm season, in the beginning of Summer, especially with warm nights, wax moths are more active.
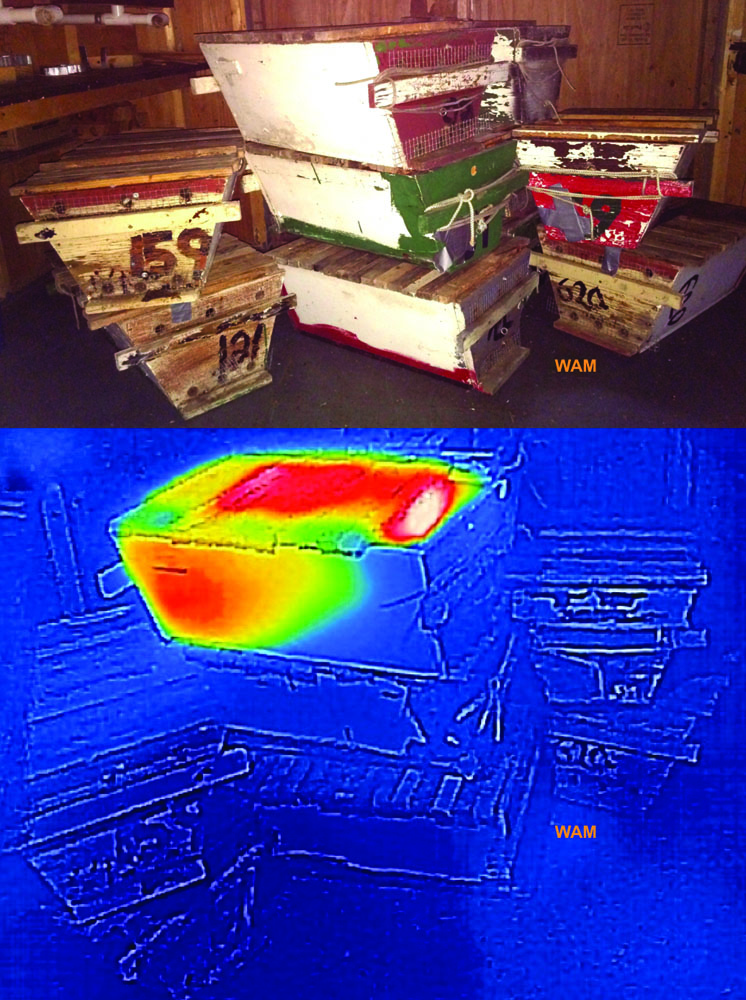
Figure 8 (upper) Top-bar hives full of empty combs ready to be moved to fumigation storage until next Spring. Temporarily, they are in my bee house that holds 30 top-bar observation hives used for my research. In the beginning of Summer, I left the combs unprotected a little too long. (lower) A thermal image of the same pile of hives. The top hive has a raging case of wax moths infesting the combs and producing heat.
I became busy with other projects and left the pile of these hives as you see them, figuring the comb would be safe for about a week. I was almost correct, as shown by the warm hive on top of the pile (see Figure 8, lower). When wax moth larvae consume combs, they produce metabolic heat. If the infestation is large enough, and consequently warmer than the surroundings, the camera can detect a heat difference. The result: a heat signature made by moth larvae. I knew wax moth larvae produce heat. During Fall inspections, I have seen a very weak bee cluster shift next to a ball of wax moth webs–for warmth, which I too could feel on a cool day. I thought bees getting warm from worms consuming their colony was just plain depressing–and that was before we had varroa and beetles!
With new technology come careful and wise use. First if a colony shows a normal heat pattern (for now that appears like Figure 4), it could still harbor problems that have not disturbed its heat signature. Therefore, the thermal camera is not a substitute for timely colony inspections. For management, the thermal camera is to make beekeeping more efficient, and perhaps to eliminate some colony inspections, lowering stress on the bees, but it is not a tool for lazy beekeeping.
Furthermore, for efficiency I want to find the colonies that need critical attention first. Here is an example I would like to see happen. Assuming all the Summer colonies above were in the same out-apiary far from home, the heat signatures would tell me the problem ones to inspect first. Then I would detect, for example, the still strong colony with laying workers first (the hive of Figure 7, upper). Now I know what I need to transfer to that colony to salvage it, as I inspect the other colonies, the one with normal heat signatures (Figure 4). If I found the problem colony near the end of the apiary inspection, I would need to reopen hives for what I needed–inefficient. When I have numerous hives in several apiaries to inspect, I do not want to back up. The last hive to inspect for the day, the finish line, is the other way, into the hives not yet opened, the ones also needing attention.
Hopefully thermal cameras will keep us moving forward towards better beekeeping.
Acknowledgments
The author thanks Suzanne Sumner for her comments on the manuscript.
Visit www.TBHSbyWAM.com.