


Thermal cameras have become an important part of my colony management and a tool for my scientific research.
Wyatt Mangum
In Bee Culture (March 2016), I showed how to use a thermal camera to observe colonies in the Winter. Some of those images (called heat signatures) from the Winter of 2014/15 did not fit into the expected behavior of bees forming winter clusters in top-bar hives. This article examines the unusual heat signatures of Hive 11, a three-foot long top-bar hive.
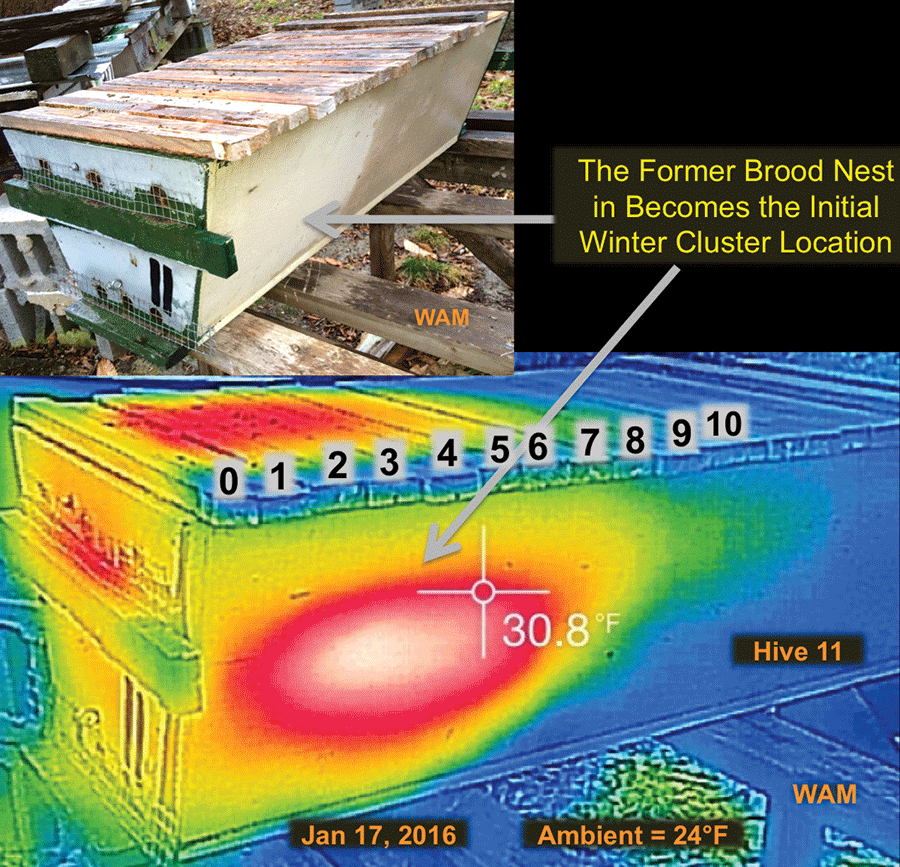
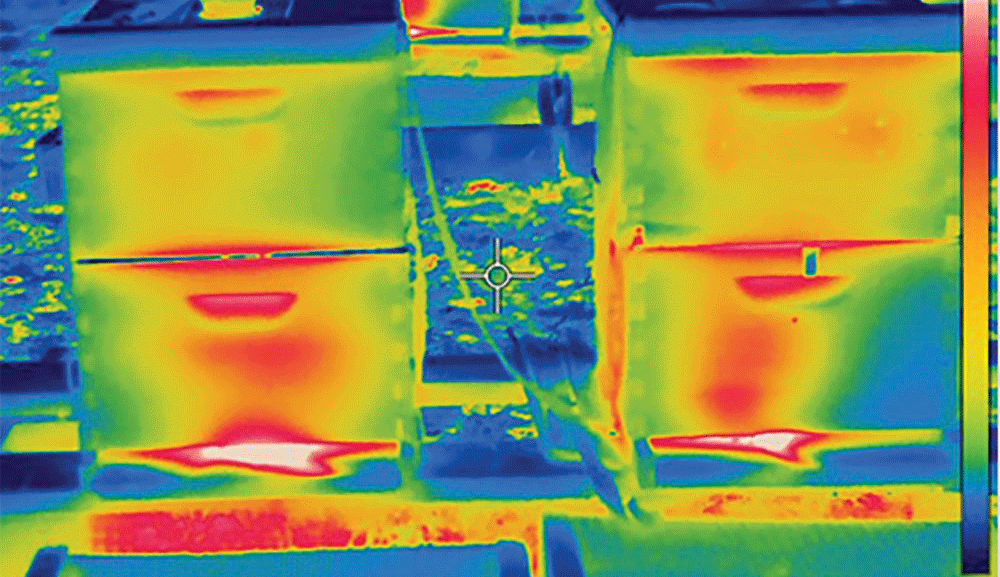
Figure 1.
In Figure 1, the upper panel shows Hive 11 as it appears in the apiary with its metal cover removed. The lower panel shows its typical heat signature for mid January at 24˚F. The oval white pattern represents the warmest temperature corresponding to the central part of a Winter cluster. The other surrounding colors represent progressively cooler temperatures, a band of red, a wider band of yellow, a thin band of green, fading into the coolest background color of blue.
A convenient feature of a top-bar hive is that the combs can be numbered and used to indicate places in the hive from the entrance end of the hive. In Figure 1, I numbered the first 10 top-bar combs from the entrance end. Unlike a standard frame hive, the top-bar combs have a unique order from the entrance end of the hive. The number zero marks a narrow wooden cleat, which helps me gain access to Comb 1. From the heat signature of Hive 11, I would expect to encounter the Winter cluster on the back side of Comb 1, where the white color begins. The bees are not directly adjacent to the entrances. They have an empty comb barrier, which is typical, although large clusters may lack one. I expect the cluster would end somewhere near the back side of Comb 4, where the white color ends.
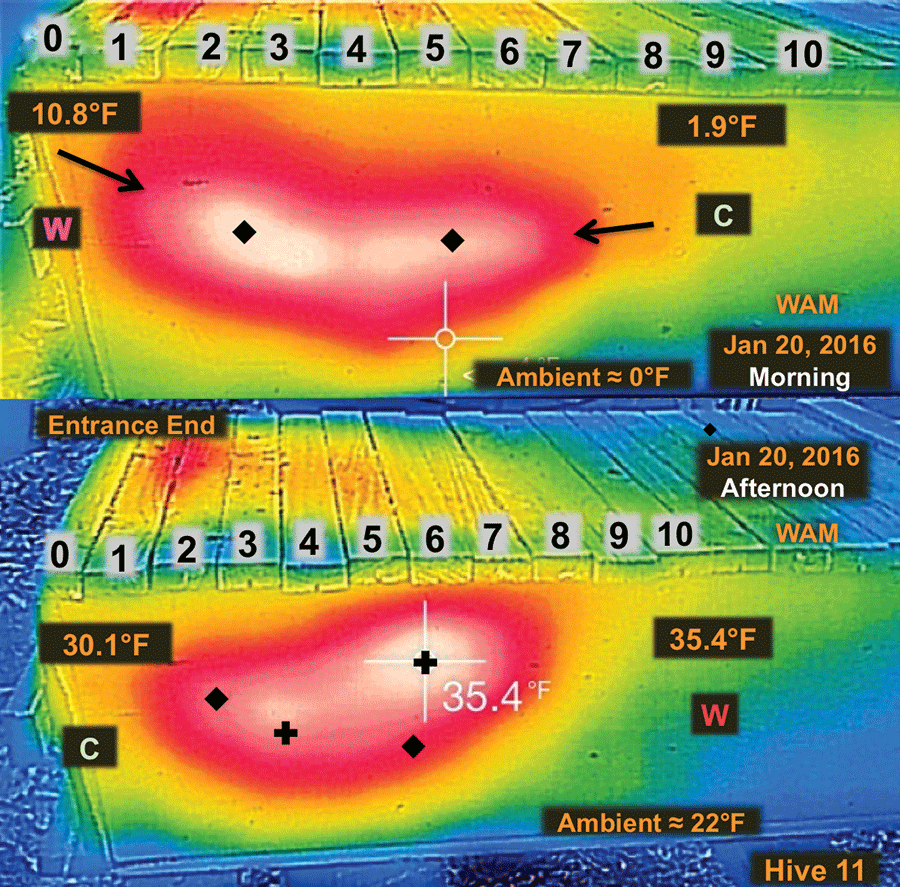
Figure 2.
On January 20, 2016, a complicated heat signature appeared on Hive 11, comprising three main unusual features. First, a heart-shaped pattern shown in Figure 2 (upper panel) replaced the oval pattern of Figure 1 (lower panel). Second, the lobes of the heart pattern had different temperatures. The lobe temperatures, simplified as warmer and cooler, changed left and right positions, during the day. The warmer left lobe (morning) became the cooler left lobe (afternoon). Likewise, the cooler right lobe (morning) became the warmer lobe (afternoon). Third, the vertical position of the right lobe seemed to have risen over the day changing the tilt of the heart pattern.
Now let’s look at Figure 2 in detail, starting from the left. In the morning, the left lobe appears to dominate with a brighter area of white, indicating a warmer temperature. The warmest place of the left lobe yielded a surface temperature of 10.8˚F marked near the left black diamond. The left lobe tilted up with a white core beginning near the back side of Comb 2, and continuing until near the front side of Comb 4.
In the middle of the heat signature, under Comb 4 appeared a cooler region (shown in red), which separated the lobes. That cool dividing region persisted over the day. What caused it to appear? That location in the middle should have been the warmest part of the heat signature.
Overall the right lobe in the morning was cooler with its warmest surface temperature only 1.9˚F taken near the right black diamond. The right lobe was smaller and lower on the hive. Its white core began near the back side of Comb 4, continued as shown, until near the back side of Comb 6.
In the afternoon, the approximate ambient temperature increased from 0˚F to 22˚F, well below when clusters would show activity (at least on the cluster surface). The day remained clear with little wind in the apiary. The sun could slightly warm the Figure 2 side of the hive, shining evenly on it until noon. Other hives in the apiaries had the same sun exposure, but they did not show the heart-shaped heat signature.
By the afternoon, the warmth of the lobes appeared to reverse. The lower panel of Figure 2 shows the left lobe seemed to have diminished considerably, much less of the warmest white color, compared to the right lobe of white warmth. However in the afternoon, the camera used a different temperature color scale to account for the new higher temperatures in the 30s˚F. In the region of the left lobe from the morning, the black diamond had been reassigned from morning-white to afternoon-red. So the left lobe was there, even with a warm core (faint afternoon white) between Combs 3 and 4. The warmest place of the left lobe yielded a temperature of 30.1˚F marked near the left black cross. The new warmer lobe on the right dominated, high up on the hive (bright afternoon white), on Combs 5 and 6 marked by the right black cross, which was the warmest location on the right. The warmest place of the right lobe yielded a temperature of 35.4˚F marked near the right black cross. (I “plotted” the black diamonds from the morning on the lower afternoon panel to indicate the approximate shift in the warmest regions.)
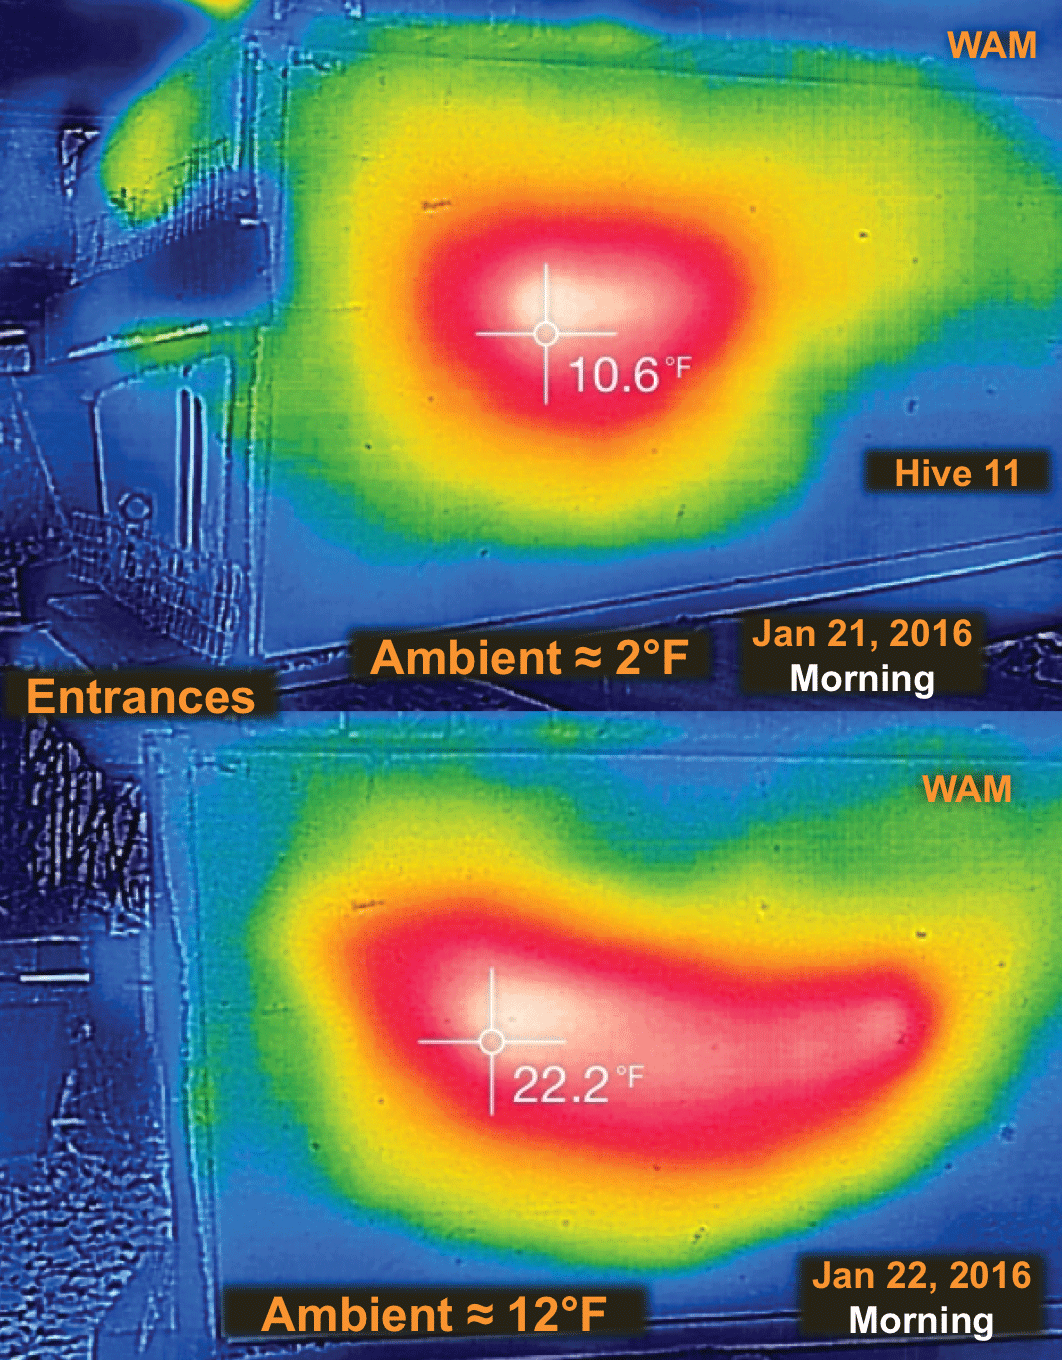
Figure 3.
The next morning on the 21st, Figure 3 (upper panel) showed the heart-shaped heat signature had not returned, only an oval, somewhat similar to the one on January 17, 2016 (see Figure 1), but this one was more compact. The next morning on the 22nd, the heart pattern seemed to be returning with the left lobe the warmest at 22˚F, like Figure 2. (I could not return for an afternoon reading.)
In the two previous figures (Figures 2 and 3), the other side of Hive 11 showed only a red amorphous heat signature (no pattern). On February 12, 2016 that abruptly changed. Now both sides of Hive 11 showed novel heat signatures (see Figure 4). The upper panels show the heat signatures of the sides of the hive. The panels below show close-ups of the corresponding heat signatures above. The close ups show the white core regions appearing as a horizontal “rod” on the left and a “triangle” on the right.
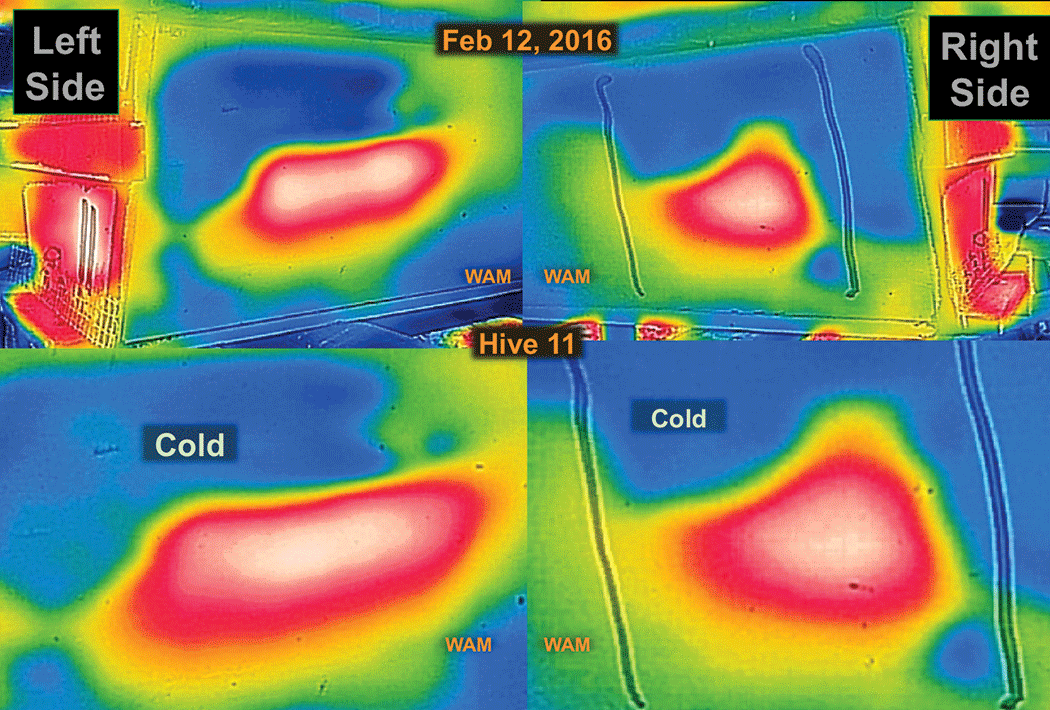
Figure 4.
Even more striking, these heat signatures showed a sudden transition from the warmest white core to the blue coldest region directly above. The intermediate colors (red, yellow and green) were squeezed into very narrow bands. That represented a rapid temperature reduction from warm to cold, or white to blue. Given that heat rises, a more gradual gradient from warm (lower) up to cold (higher) should have occurred as in the other images (for example see Figure 1, lower panel). What happened to cause such a severe change to cold? I marked “Cold” on Figure 4 where the region seems too cold given the closeness of the cluster heat. I wondered if this cold above the cluster was a cold air current flowing over the cluster. If so, I would I expect to see it more often, but I only observed Hive 11 for a couple of days with this pattern, although I could not check the hive often. Another mystery.
I definitely wanted to inspect Hive 11 come Spring. I can inspect my top-bar hives in frigid Winter cold, even at night, even when it is raining or snowing. I only do that in dire conditions or when I need to collect data at a specific time. I considered conducting a limited inspection, just going into the ends of the Winter cluster and seeing its closeness to the hive walls. However when studying bees, patience is of prime importance, particularly when seeing something new. A Winter hive inspection could easily destroy the unusual heat signatures, although the disruption would be fairly minimal. Nevertheless, I waited. When I finally inspected Hive 11, guess what? Normal. Nothing out of the ordinary, at least by early Spring, long after the unusual heat signatures had ceased.
Hive 11 showed the thermal camera might become more than a diagnostic tool indicating the survival status of a colony as shown in Bee Culture (March 2016). The temperature changes in the heart-shaped pattern might be revealing something about changes in the winter cluster, but I need more temperature data than from one hive. Similar heart-shaped patterns appeared on other hives, but I could not collect much data from them, given their distances. (However, overall the heart-shaped pattern seems rare.) This Winter (2016/17), I am using a larger sample of top-bar hives, closer to home, and in various designs. Some hives have removable glass sides allowing direct thermal photography of the cluster, avoiding any heat distortion through the wooden sides. Hive 11 is at my home apiary where I can observe it daily.
This Winter my thermal work should keep me busy in my apiaries, hopefully to explain these heat signatures and perhaps observe new ones.
Acknowledgments
The author thanks Suzanne Sumner for her comments on the manuscript.
Visit http://TBHSbyWAM.com