


USDA Reports with Supplementary by Kim Flottum
Released March 17, 2023, by the National Agricultural Statistics Service (NASS), Agricultural Statistics Board, United States Department of Agriculture (USDA)
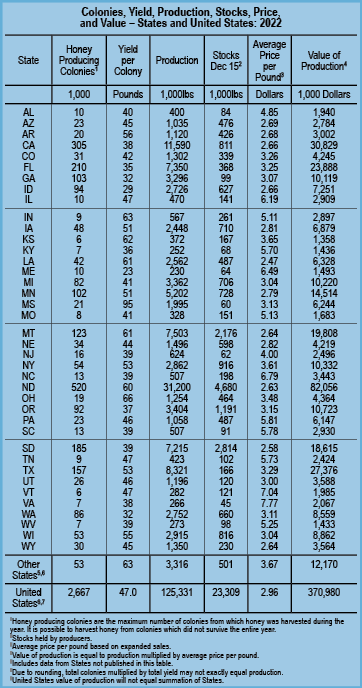 United States Honey Production Down One Percent in 2022
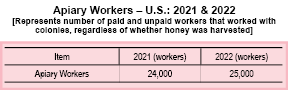
United States honey production in 2022 totaled 125 million pounds, down one percent from 2021. There were 2.67 million colonies producing honey in 2022, down one percent from 2021. Yield per colony averaged 47.0 pounds, unchanged from 2021. Colonies which produced honey in more than one state were counted in each state where the honey was produced. Therefore, the United States level yield per colony may be understated, but total production would not be impacted. Colonies were not included if honey was not harvested. Producer honey stocks were 23.3 million pounds on December 15, 2022, down one percent from a year earlier. Stocks held by producers exclude those held under the commodity loan program, which are entered separately.
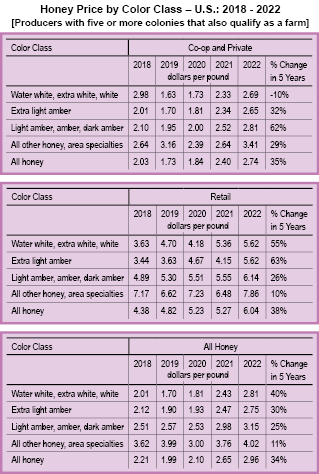
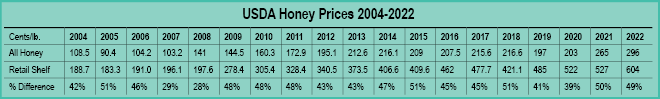
Honey Prices Up 12 Percent in 2022
United States honey prices increased 12 percent during 2022 to $2.96 per pound, compared to $2.65 per pound in 2021. United States and state level prices reflect the portions of honey sold through cooperatives, private and retail channels. Prices for each color class are derived by weighing the quantities sold for each marketing channel. Prices for the 2021 crop reflect honey sold in 2021 and 2022. Some 2021 crop honey was sold in 2022, which caused some revisions to the 2021 crop prices.
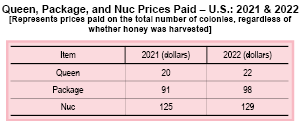
Price Paid for Queens, Packages, Nucs was 22 Dollars in 2022
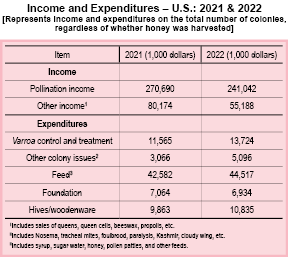
The average prices paid in 2022 for honey bee queens, packages and nucs were $22, $98 and $129, respectively. Pollination income for 2022 was $241 million, down 11 percent from 2021. Other income from honey bees in 2022 was $55.2 million, down 31 percent from 2021.
 Released August 1, 2022, by the National Agricultural Statistics Service (NASS), Agricultural Statistics Board, United States Department of Agriculture (USDA).
January 1, 2021 – Some History
Honey Bee Colonies Down One Percent for Operations with Five or More colonies
Honey bee colonies for operations with five or more colonies in the United States on January 1, 2022 totaled 2.88 million colonies, down one percent from January 1, 2021. The number of colonies in the United States on April 1, 2022, was 2.92 million colonies. During 2021, honey bee colonies on January 1, April 1, July 1 and October 1 were 2.90 million, 2.83 million, 3.17 million and 3.09 million colonies, respectively.
Honey bee colonies lost for operations with five or more colonies from January through March 2022, was 331,780 colonies, or 12 percent. The number of colonies lost during the quarter of April through June 2022, was 282,630 colonies, or 10 percent. During the quarter of January through March 2021, colonies lost totaled 464,640 colonies, or 16 percent, the highest number lost of any quarter surveyed in 2021. The quarter surveyed in 2021 with the lowest number of colonies lost was July through September, with 295,660 colonies lost, or nine percent.
 Honey bee colonies added for operations with five or more colonies from January through March 2022 was 367,890 colonies. The number of colonies added during the quarter of April through June 2022 was 589,630. During the quarter of April through June 2021, the number of colonies added were 665,730 colonies, the highest number of honey bee colonies added for any quarter surveyed in 2021. The quarter of October through December 2021 added 93,940 colonies, the least number of honey bee colonies added for any quarter surveyed in 2021.
Honey bee colonies renovated for operations with five or more colonies from January through March 2022 was 187,180 colonies, or seven percent. During the quarter of April through June 2022, the number of colonies renovated were 492,410 colonies, or 17 percent. The quarter surveyed in 2021 with the highest number of colonies renovated was April through June 2021 with 475,750 colonies renovated, or 17 percent. The quarter surveyed in 2021 with the lowest number of colonies renovated was October through December 2021, with 146,520, or five percent. Renovated colonies are those that were requeened or received new honey bees through a nucleus (nuc) colony or package.
Varroa Mites Top Colony Stressor for Operations with Five or More Colonies
Varroa mites were the number one stressor for operations with five or more colonies during all quarters surveyed in 2021. The period with the highest percentage of colonies reported to be affected by varroa mites was April through June 2021 at 50.7 percent. The percent of colonies reported to be affected by varroa mites during January through March 2022 and April through June 2022 are 33.7 percent and 45.2 percent, respectively.
Colonies Lost with Colony Collapse Disorder Symptoms Up 12 Percent for Operations with Five or More colonies
Honey bee colonies lost with Colony Collapse Disorder symptoms on operations with five or more colonies was 86,070 colonies from January through March 2022. This represents a 12 percent increase from the same quarter in 2021.
If you want to explore USDA’s survey results further, start here:
Access to NASS Reports are available for your convenience, you may access NASS reports and products the following ways:
-
- All reports are available electronically, at no cost, on the NASS website: www.nass.usda.gov.
- Both national and state specific reports are available via a free e-mail subscription. To set-up this free subscription, visit www.nass.usda.gov and click on “National” or “State” in upper right corner, above the “search” box to create an account and select the reports you would like to receive.
- Cornell’s Mann Library has launched a new website housing NASS’s and other agency’s archived reports. The new website: https://usda.library.cornell.edu. All email subscriptions containing reports will be sent from the new website, https://usda.library.cornell.edu. To continue receiving the reports via e-mail, you will have to go to the new website, create a new account and re-subscribe to the reports. If you need instructions to set up an account or subscribe, they are located at: https://usda.library.cornell.edu/help. You should whitelist notifications@usdaesmis.library.cornell.edu in your email client to avoid the emails going into spam/junk folders.
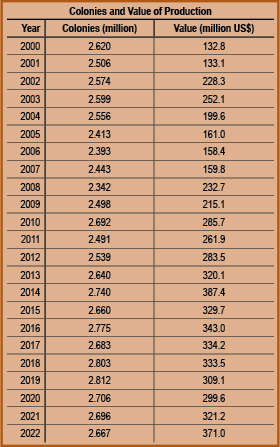
Per Capita Consumption, 2022
We calculate this figure each year using data from USDA ERS, NASS, ERS, FARM SERVICE and the U.S. Census Bureau. From these sources we determine how much honey entered the system, how much honey left the system, how much was used, how much wasn’t used and the population on July 1, 2022. These figures include U.S. production, U.S. exports, honey put under and taken out of the loan program and honey remaining in storage, plus how much was imported from off shore. Essentially, it’s a measure of honey in minus honey out. The resultant figure, divided by how many people were here on that particular date results in how much honey was consumed by each and every individual in the U.S. last year. And yes, you are correct, not every person eats honey, but by producing this figure on an annual basis, we are able to compare apples to apples each year in honey consumption.
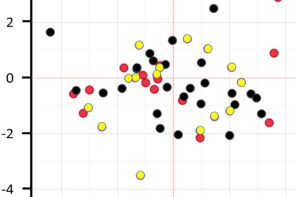
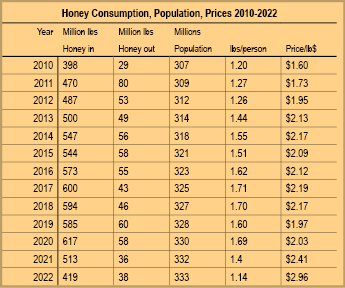 The chart compares these figures for the previous 13 years. We’ve included the USDA’s price of all honey for comparison too.
Honey Into the U.S., 2022
U.S. beekeepers with more than five colonies in 2022 produced, according to USDA, 125.3 million pounds of honey. The Honey Board calculates that an additional eight million pounds or so are produced by those with fewer than five colonies for a total production of 133.3 million pounds. Additional honey in figures include 23.3 million pounds taken out of warehouses from last year, two million pounds taken out from last year’s loan program and a whopping 260.9 million pounds imported for a rough total of 419.5 million pounds of honey in, during 2022. This honey sold, on average, wholesale, retail and specialty honey for $2.96/pound, according to USDA figures. Commercial beekeepers in the U.S. will tell you to make a living, this price should be about the same price as diesel fuel. Take a look next time you are at the gas station.
Honey Out of U.S. Stock, 2022
For the honey out figure, we exported nearly 12.3 million pounds to other countries, have nearly 23.3 million pounds still sitting in warehouses and put just under two million under loan, for a total of about 38 million pounds of honey produced in 2022 that were moved out of the U.S. figures for 2022.
The July 1, 2022 population was right at 333.3 million people in the U.S. So, to calculate per capita consumption, subtract honey out (put under loan, exported or still in warehouses) from honey in (honey produced this year, left over from last or imported) and divide by 333.3 million, for a total of 382 million pounds consumed in the U.S. last year. Divide this by 333 million people which gives you about 1.2 pounds of honey per person consumed by people in the U.S. during 2022, the lowest since 2012.
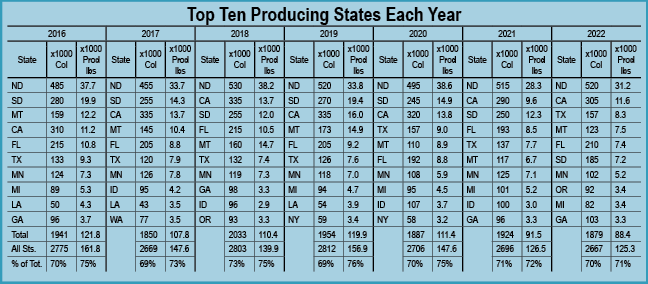
The top 10 producing states produced a total of $8,844,300 with a total of 1.879 million colonies. This comes to 70.4% of the U.S. colonies, and 70.6% of total dollar value.
The top three producing states had a total of 982,00 colonies, producing a total of $51,111,000. This comes to 36.8% of all colony production in the U.S. in 2022, producing 57.8% of total production dollars. Moreover, these three states produced 36.8% of all the colonies in the U.S. in 2022.
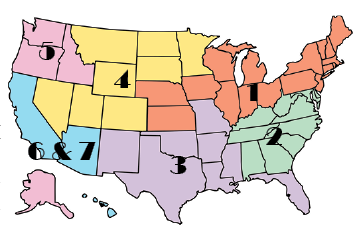
Top 10 Producing States
The places that yield the most honey every year are pretty much determined by the climate, the soil, agriculture and politics. The crops grown, or not grown in a region certainly play a role in what can be found relative to nectar, pesticides and regulations relative to how many colonies you can put on any given acre, that won’t starve after a couple of months. Of course, government conservation programs lend a hand here too.
We’ve been curious about this for the last eight years or so, just because it’s interesting to see what changes, and what doesn’t. The Dakotas, California, Montana, Florida, Minnesota, and Texas are almost always in the top eight, with the last two changing occasionally: New York, Louisiana, Georgia, Idaho, Michigan and perhaps a few others round out these performers.
This year provided few surprises in who is on the list, and the totals for the top 10 this year were essentially where they always are relative to the number of colonies counted in these states and the amount of honey produced. Again, these states produced 70% of all of the honey produced in the U.S., and had 70% of all the colonies in the U.S. sitting somewhere within their borders. It’s pretty clear that what happens in these few states is going to determine the U.S. crop.
But, just because we can, this year we looked at the contributions of the top three states, for almost every year, the Dakotas and Texas. Combined, they held on to 52.3% of the colonies used last year and produced just over 40% of all the honey U.S. beekeepers made last year. This means, of course, that 52% of the colonies, and 60% of the U.S. honey crop is spread out over the remaining 47 states. You can see this comes to just under 1%/state. That sort of puts us in our place, doesn’t it? This extreme unbalanced situation commands notice, then, as to what will happen when climate change erodes, or doesn’t, weather patterns in these three states including rainfall, Summer and Winter temperatures, farming practices and conservation practices.
Already, drought in the western third of the U.S. is having an effect, not only on the bees, but their forage and the crops they pollinate as well. Like it or not, we are at the mercy of big weather – call it climate change or whatever – it’s dry out there!
Released January 11, 2023, by the National Agricultural Statistics Service (NASS), Agricultural Statistics Board, United States Department of Agriculture (USDA)
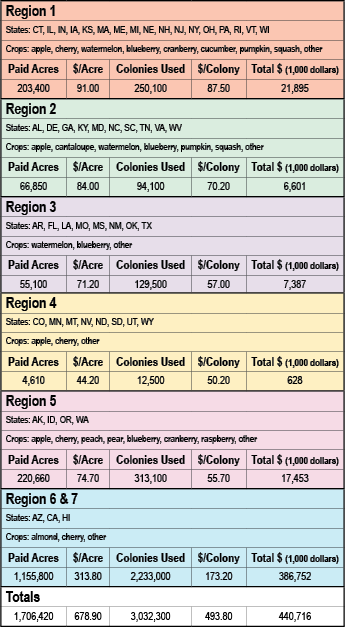 Pollination Costs and Income, 2022
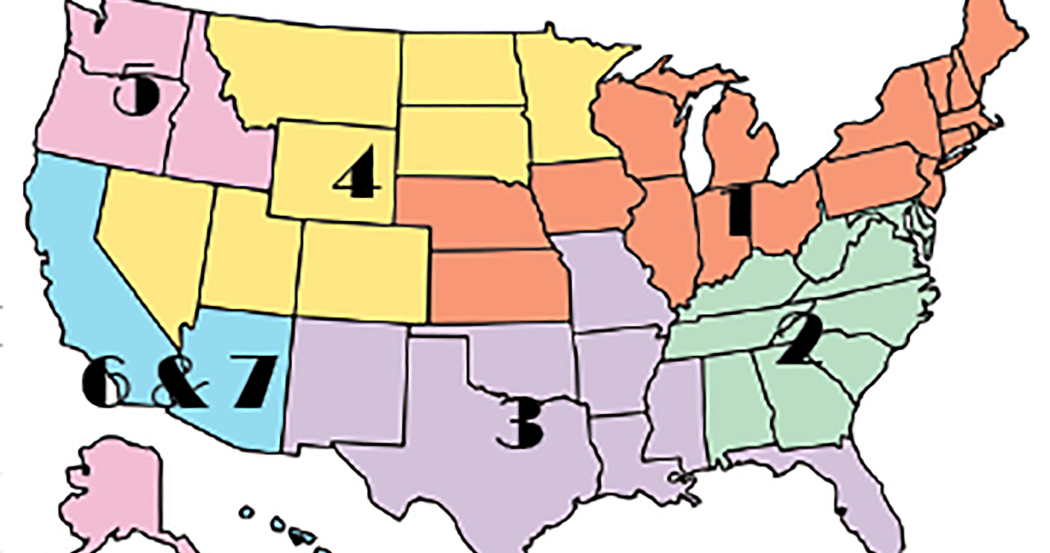
Cost Per Colony to Pollinate Almond Up 13 Percent from 2017
In Regions 6 & 7, the average cost per colony for almonds increased 13 percent from 171 dollars per colony in 2017 to 194 dollars per colony in 2022. The average price per acre increased from 272 dollars per acre to 336 dollars per acre during that period. The total value of pollination for almonds increased 44 percent. Almonds were the highest valued crop in that region. The total value of all pollination in Regions 6 & 7 for 2022 was 387 million dollars, up 42 percent from 2017.
Blueberries had the highest total value of pollination of crops reported in Region 1 in 2022. The price per colony for blueberries increased 27 percent to 98.4 dollars per colony in 2022. The price per acre increased 42 percent to 179 dollars per acre. The total value of pollination for blueberries in Region 1 for 2022 was 8.56 million dollars. The total value for pollination of all crops in Region 1 for 2022 was 21.9 million dollars, up 33 percent from 2017.
Blueberries had the highest total value of pollination of crops reported in Region 2 in 2022. The price per colony for blueberries increased 40 percent to 78.3 dollars per colony in 2022. The price per acre increased 63 percent to 139 dollars per acre. The total value of pollination for blueberries in Region 2 for 2022 was 3.60 million dollars. The total value of pollination of all crops in Region 2 for 2022 was 6.60 million dollars, up 10 percent from 2017.
Watermelons had the highest total value of pollination of crops reported in Region 3 in 2022. The price per colony for watermelons increased 38 percent to 76.9 dollars per colony in 2022. The price per acre increased 57 percent to 100 dollars per acre. The total value of pollination for watermelons in Region 3 for 2022 was 1.85 million dollars. The total value of pollination of all crops in Region 3 for 2022 was 7.39 million dollars, up eight percent from 2017.
Apples had the highest total value of pollination of crops reported in Region 4 in 2022. The price per colony for apples increased three percent to 51.7 dollars per colony in 2022. The price per acre decreased slightly to 41.0 dollars per acre. The total value of pollination for apples in Region 4 for 2022 was 114 thousand dollars. The total value of pollination of all crops in Region 4 for 2022 was 628 thousand dollars, down 27 percent from 2017.
Apples had the highest total value of pollination of crops reported in Region 5 in 2022. The price per colony for apples increased 12 percent to 58.3 dollars per colony in 2022. The price per acre increased 36 percent to 62.8 dollars per acre. The total value of pollination for apples in Region 5 for 2022 was 6.59 million dollars. The total value of pollination of all crops in Region 5 for 2022 was 17.5 million dollars, up four percent from 2017.