


By Kim Flottum
United States honey production in 2017 from producers with five or more colonies totaled 148 million pounds, down nine percent from 2016. There were 2.67 million colonies producing honey in 2017, down four percent from 2016.
Yield per colony averaged 55.3 pounds, down five percent from the 58.3 pounds in 2016. Colonies which produced honey in more than one State were counted in each State where the honey was produced. Therefore, at the United States level yield per colony may be understated, but total production would not be impacted. Colonies were not included if honey was not harvested. Producer honey stocks were 30.6 million pounds on December 15, 2017, down 26 percent from a year earlier. Stocks held by producers exclude the 2.8 million pounds, held under the commodity loan program.
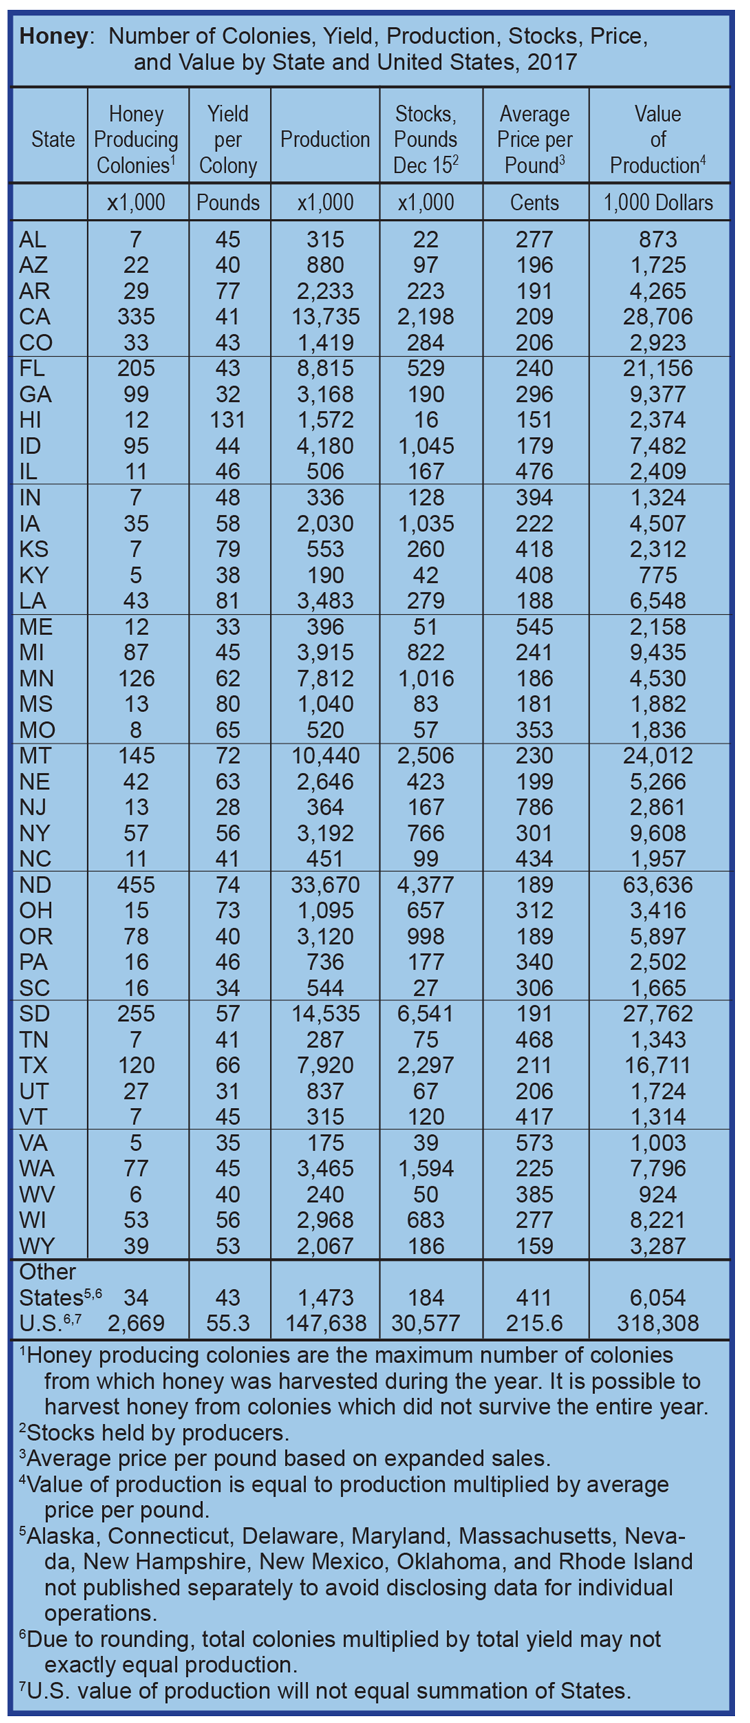
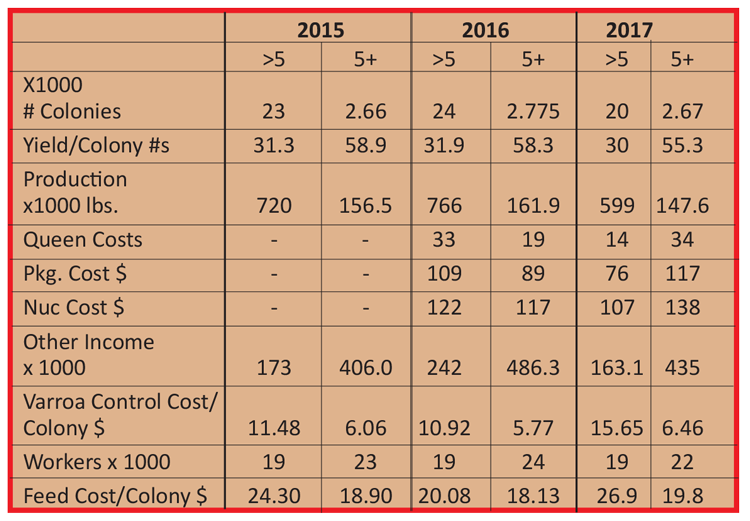
United States honey production in 2017 from producers with less than five colonies totaled 599 thousand pounds, down 22 percent from 2016. There were 20 thousand colonies from which honey was harvested in 2017, down 17 percent from 2016. The average yield was 30.0 pounds per colony in 2017, down six percent from the previous year.
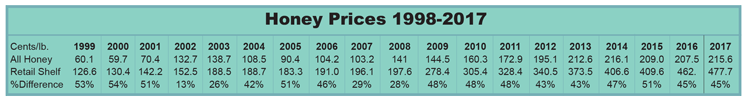
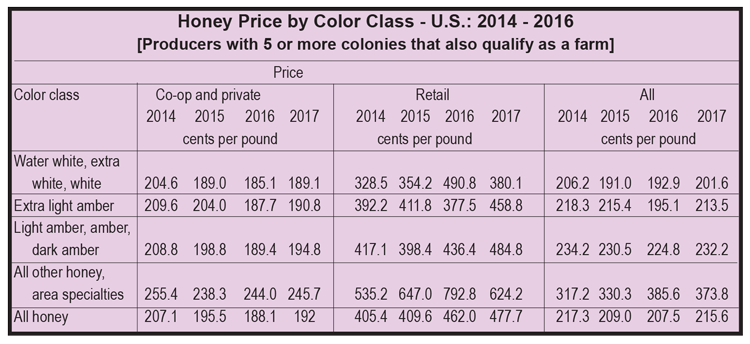
United States honey prices increased two percent during 2017 to 215.6 cents per pound, compared to 211.9 cents per pound in 2016. United States and State level prices reflect the portions of honey sold through cooperatives, private, and retail channels. Prices for each color class are derived by weighting the quantities sold for each marketing channel. Prices for the 2016 crop reflect honey sold in 2016 and 2017. Some 2016 crop honey was sold in 2017, which caused some revisions to the 2016 crop prices.
For operations with five or more colonies, the average prices paid in 2017 for honey bee queens, packages, and nucs were $14, $76, and $107 respectively. The average prices paid in 2017 for operations with less than five colonies were $34 per queen, $117 per package, and $138 per nuc. For operations with five or more colonies, pollination income for 2017 was $435 million, up 29 percent from 2016. Other income from honey bees for operations with five or more colonies in 2017 was $163 million, up 10 percent from 2016.
•
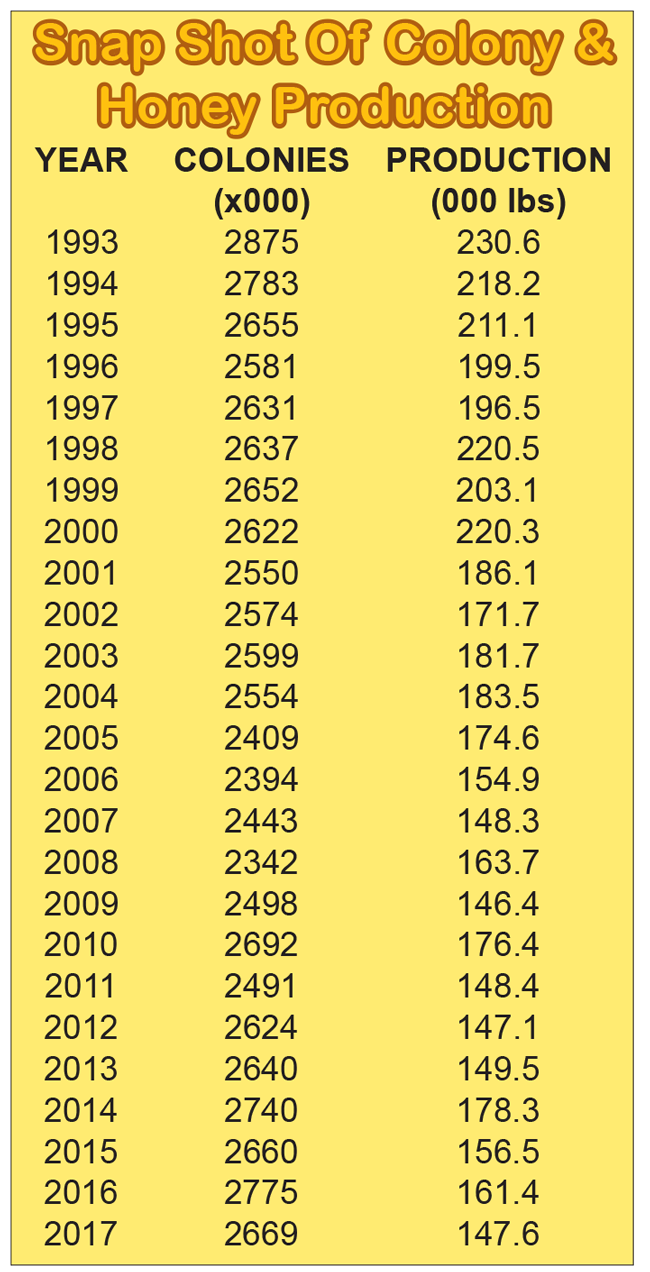
Well, the government has spoken, again, and their numbers look, actually, pretty encouraging all things considered. Bee Culture, if you recall, conducted a similar survey last November, using our Monthly Honey Report reporters. We’ve been doing that for some time and are usually close enough to the NASS numbers that we confidently make predictions that early. We missed it this year by quite a margin, but for a good reason. Our reporters gave us the number of colonies they had, and the number of colonies that produced honey. We projected that ratio onto the number of NASS colonies from 2016 to give us a working number of honey producing colonies in the U.S. for 2017. We also used the average pounds/colony number, 45, of our reporters and did the math for the number of colonies, and came up with a U.S. production for 2017 of 98.6 million pounds. That number came out to be two thirds of the NASS crop numbers. Why? We figured there would be 2.2 (as opposed to the 2.7) million colonies, each producing only 45 (as opposed to the 55) pounds each. We’ve been leaning in the direction that the number of beekeepers making honey as a first source of income, or even a second source are declining. Rather, they are concentrating on making bees, for other beekeepers who make honey or need more for pollination, or simply for themselves to increase their pollination capability, and thus income. The snap shot of colony and honey production on page 28 shows colony number remaining pretty steady for the past 25 years, while honey production has slowly, but steadily decreased during the same time frame.
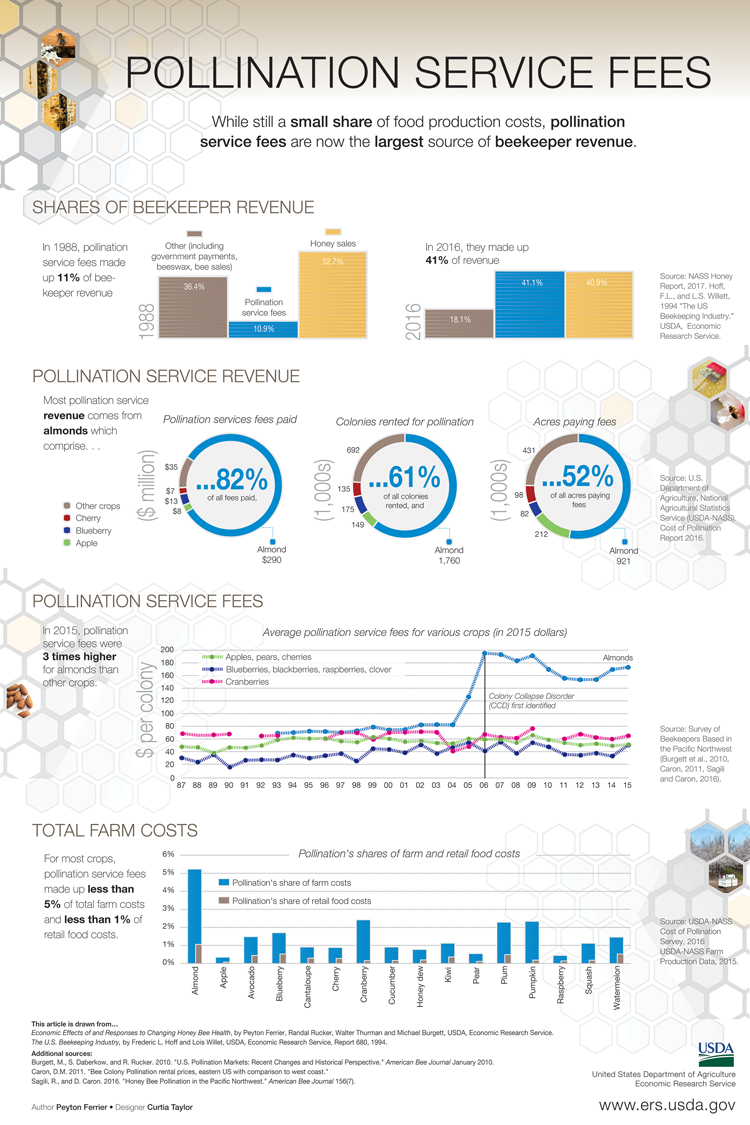
What’s also shown on the cost comparison chart is that the costs of keeping bees for commercial beekeepers continue to escalate, but that the prices for both honey and pollination have increased also. So, to make the same income, one could generalize, you don’t have to make as much honey because you are getting paid more for it, and every colony you put into pollination earns more money each year. So a stable colony number keeps a beekeeper stable…certainly not rich, but at least breathing air.
A good picture of the pollination side of this is the ERS Infographic showing the changes in income from pollination between 1988 and 2016. Without a doubt almond pollination has changed the picture completely, but look closely at the Total Farm Costs part of the picture. Pollination costs to both farmers, and consumers is, with the exception of almonds, less than 1%, and for almonds only 5%. And as far as affecting retail food costs – less than 1%. Yet without that service, there are no crops. Pollination has as much, or more value than water when it comes to growing food, yet do beekeepers, and their bees get as much credit, or cause as much grief as the lack of water? Not even close!
And look closely at the data at the top of the chart. Other income for beekeepers has dropped by half since 1988. Other income includes bees, beeswax and government payments. It doesn’t break out the percent each of these represent which is unfortunate, but we suspect government payments is a chunk (there are, essentially no government payments anymore) of this. It would have been very revealing to see what percent of this income was do to sales of bees however, since we know that has increased.
The top 10 honey producing states have changed a bit this year. Idaho and Washington have joined the elite, while Michigan and Georgia have dropped off the list. North Dakota continues to dominate the scene in both production and colonies. In 2008 they had 400,000 colonies sitting there, and last year 455,000. Five states had a higher yield per colony as theirs was only 74 pounds each, but the huge number of colonies allowed them to produce 23% of the US honey crop last year. I had the opportunity to drive across North Dakota last summer during a cross country trip in kind of a hurry, and even from the vantage point of the freeway it was clear there are a lot of bees in that state. I heard that, if you chose your path carefully, you could walk across the state stepping only on beehives, and never touch the ground. I think they were right.
South Dakota came in a distant second, with just over half as many colonies, followed by California and Montana. The bottom six combined totaled less than North Dakota, but still were noteworthy compared to the rest of us.
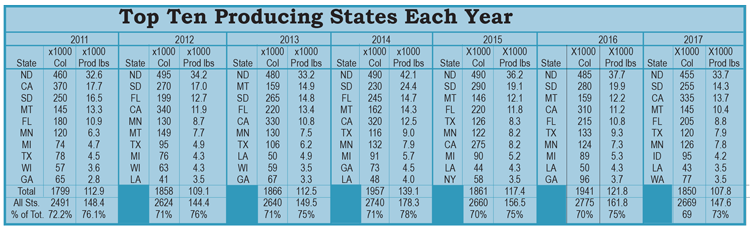
With the exception of California (up 2.5 million pounds) and Minnesota (essentially flat), every one of the top 10 states produced less honey this year than last, and combined produced only 73% of the U.S. crop, compared to the normal 75% or more.
Prices
The USDA Agricultural Marketing Service, AMS, produces a National Monthly Honey Report that provides information on colony conditions and local sales at the state level, and honey prices in volumes of 10,000 pounds for select states and markets. These are prices paid to beekeepers for extracted, unprocessed honey in major producing states by packers, handlers and other large users. The February issue is the one that has the data from all of 2017, plus January data from the U.S., and we use this data to report prices, and especially prices and amounts imported from every country that sells honey in the U.S.
The highest price paid in January to U.S. beekeepers was $2.40/lb for white California orange blossom. The lowest was $1.60 in several places for darker honeys. The highest price paid for imported honey (excluding organic) was $1.50/lb while the lowest was $.74/lb from Vietnam. Most imported honey was in the $1.00 – $$1.25 range, with a bit more paid for Canadian honeys.
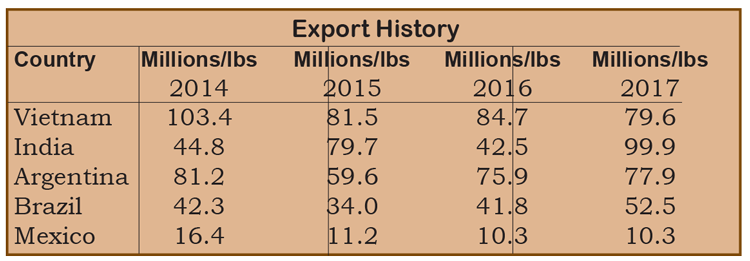
This report also gives honey exported from the US to other countries. The Philippines, South Korea, Kuwait and Canada were the big leaders for exported U.S. honey last year, but in total, we exported 9.9 million pounds, or just about 7% of last year’s total crop.
Considering the prices of imported honey it comes as no surprise that we import a great deal of honey from, we believe, any country that makes enough to fill a barrel. In total, we imported 447.8 million pounds, just over three times what we produced last year. Sixty seven percent of the honey consumed in the US last year was from off shore. That’s compared to 369.3 million pounds imported last year, a 79 million pound difference.
The Honey Price By Color chart shows these differences dramatically, and over the span of the four most recent years.
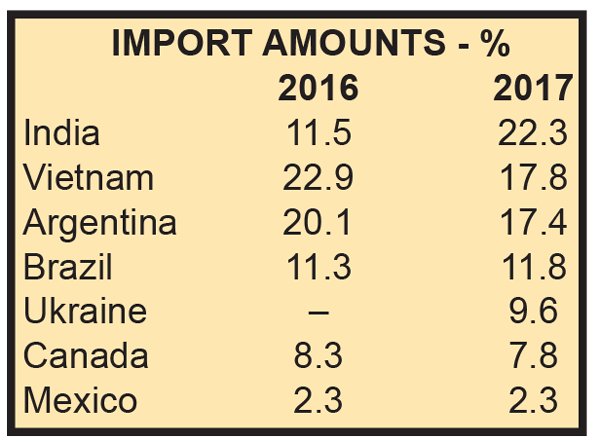
Six countries, however, dominate the global export market. India leads the way with 22.3%, twice what they did in 2016, followed by Vietnam at 17.8% and Argentina at 17.4%. So just these three contributed 57% of all imported honey to the U.S. in 2017. The increase from India is interesting, though speculation about its true origin is only that.
It’s unfortunate that there isn’t easily accessible data on honey that is turned away due to adulteration with cheaper sweeteners, contamination with substances other than sweeteners, or is mislabeled from source. The TrueSouce Honey organization is in business to determine if honey labeled from a certain country is actually from that country, and their signature goes on every bottle that is inspected. But all of it isn’t inspected so for at least some, it’s a guess.
Summary
As data collection gets better, a more focused picture of our industry shows up. Adding to this is that the number of players in the commercial market is getting smaller as consolidation continues. Of course the number of backyard beekeepers continues to grow, but even that picture is changing. Varroa has made keeping bees alive more of a challenge, and shrinking habitat is adding to that challenge. And though pesticides are still an issue, they seem to be only in some locations, while others remain less affected.
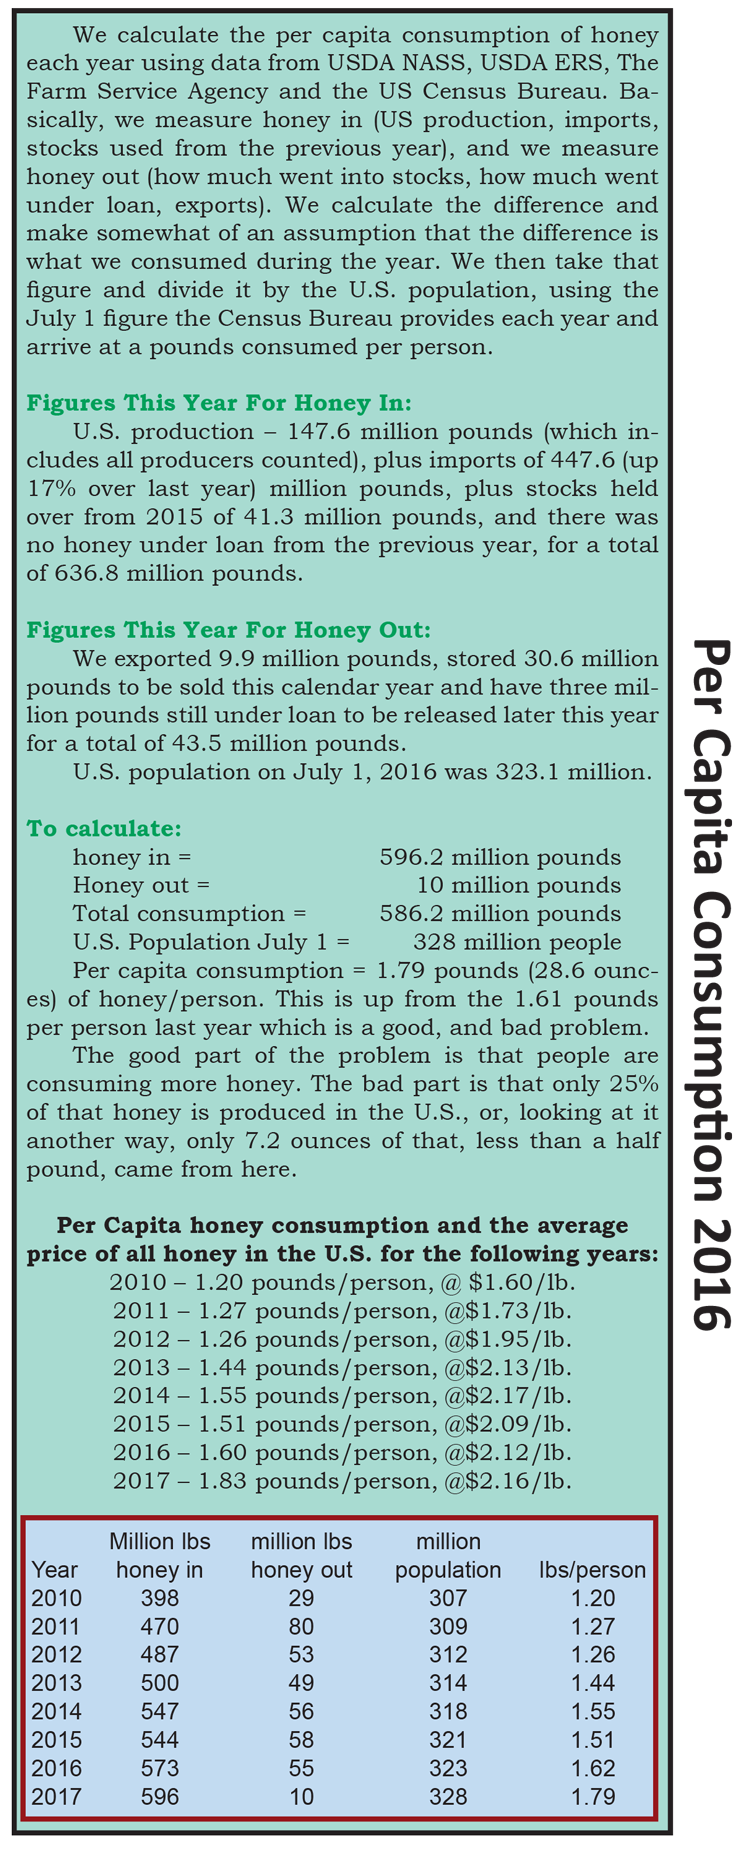
That per capita consumption continues to climb each year is heartening. The one misleading fact in that is that it reports that every single one of our 326 million people are eating 29 ounces of honey in a year. And we all know that maybe half, maybe more of those people never touch a drop of the stuff – which means we can say, probably, that for those who eat honey, each is eating nearly three pounds in a year. We need more of them, certainly.
Overall though colony numbers remain mostly unchanged, the numbers in the top 10 are down, which was unexpected. Production in those states was down also, though only in single digits, but it adds up when you look at the contribution these states make to the total.
The pollination infographic is a nice addition this year, with a big thanks to the USDA ERS for putting it together, using their data and some from several independent reports and USDA NASS data also.