
Increased Quantity Of Beneficial Fungi In Bee Bread From The Trees And Its Antifungal Propeties Against Chalkbrood
By: Lynn Royce, Jay Yoder, Blake Nelson and Andre Lorenz
Summary: We report the fungus profile of bee bread from honey bee colonies (Apis mellifera) placed in trees in order to explore this novel approach to beekeeping. Bee bread from tree colonies had approximately twice the amount of fungi, Aspergillus/Penicillium, and A. niger, as ground colonies (due to undetermined factors). A total fungus inoculum of all culturable fungi slowed or inhibited growth of chalkbrood fungus Ascosphaera apis in laboratory cultures, thus confirming the beneficial role of these fungi. Aspergillus niger alone was particularly effective at overgrowing A. apis and chemical antagonism. Two randomly selected Penicillium spp. were also growth deterrents to A. apis. Remarkably, bee bread fungi completely grew over A. apis and killed it. With more concentrated fungi from tree colonies, takeover of A. apis was more rapid. This suggests that bee bread fungi from tree colonies are more efficient at handling chalkbrood. Adding more beneficial fungi (i.e., A. niger) to bee colonies should not be expected to increase protection, and, in fact, could be detrimental by causing an imbalance of fungal components that are regulated naturally.
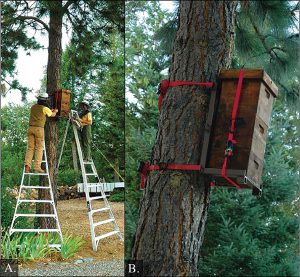
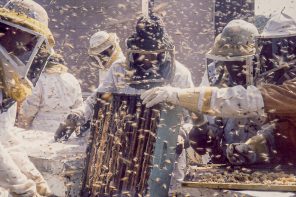
Figure 1. (A,B) Beekeepers on ladders about to inspect a tree colony of Apis mellifera in ponderosa pine. David Lytle photo.
Background: Placement of colonies of the honey bee (Apis mellifera) in trees returns the bees to their native home environment of tree hollows. Tree colonies are advantageous because they are treatment-free and alleviate many problems of maintaining standard beekeeping equipment on the ground (Royce, L. http://treehivebees.com). Mounting bee colonies eight to 12 feet (2.4-3.7 m) above the ground on a metal stand is the basis for this novel beekeeping approach (Fig. 1). This also appears to be the optimal height for attracting a swarm into an empty hive. A natural tree hollow habitat for the bees is simulated by a bio box filled with decayed woody debris placed at the base of the colony, small box design, and elevation above the ground (Fig. 2). The placement of bee colonies in the trees raises the bee’s flight path, effectively removing them from the high-risk people and pet environment on the ground. One implication of the higher flight path is broadening the conditions of the bee’s foraging habitat. Presumably, this provides access to a greater diversity of food and exposure to a different subset of symbiotic non-bee organisms that help to keep the bees healthy (Naug, 2009). Information presented in this article concerns the fungi that play a role in protecting the colony against disease and also in processing food in the form of bee bread (fungal fermentation product of stored pollen) for the developing bee larvae (Gilliam et al., 1988). Fungi are very numerous in the environment and produce copious amounts of spores, called conidia, which coat the surface of pollen grains and get trapped in nectar. Fungi in bee bread therefore originate from fungi in the bee’s foraging habitat.
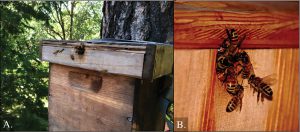
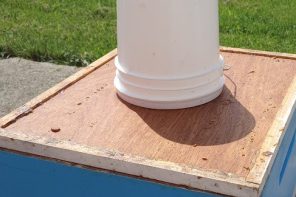
Figure 2. (A,B) Close up of a top entrance to a tree colony. An extra bottom entrance is now used. In Summer, bottom and top entrances are both open to allow for better heat elimination on hot days. In Winter, the top entrance is closed. Frames are 1/2 length of a standard deep frame. David Lytle photo.
The bee colonies for this study are in Oregon: the tree colonies are located 13 miles (21 km) SW Corvallis and the ground colonies are five miles (eight km) SW Corvallis. Their flight ranges (i.e., foraging habitats) could overlap to some extent (two to four miles, but as far as seven miles; Morse, 1984), if need be. The tree hives are south west of the colonies on the ground. They are at a slightly higher elevation than the ground colonies, and are surrounded by Christmas tree fields and timber lands. The bee colonies on the ground are on the edge of the coast range surrounded by agriculture, bordering on a dairy, with mostly grass seed fields and grain fields. At the time of this study, there are three colonies in the trees. This seems to be a sustainable number for this area, as no recent robbing has been observed. None of these colonies are treated, so there is the possibility of always having to replace bees. Of the tree hives, the first was a swarm that was hived this spring (2014), the second was hived last Summer and overwintered, and the third is in its third Summer. The third and oldest colony is in two nucleus colony boxes. The nucleus box is about twice the length of one of the tree hive bee boxes. There are two such boxes of that colony, and the other two tree hive colonies have three boxes. All three colonies take up approximately the same volume and have the bio box underneath.
Some benefits associated with the tree colonies have been seen, even within the first year. There seem to be fewer predators bothering the tree colonies; i.e., no yellow jackets, raccoons, or skunks. In past years bears have also taken out colonies on the ground; however, it is not known if bears could take out the tree colonies. Tree colonies have also overwintered more successfully than colonies on the ground and needed less in the way of stored food, but this may be due to the fact that they are smaller colonies. Culturing bee colonies on the ground has changed nearly every parameter that the bees have evolved after hundreds of years of living in the trees. These parameters include size of the colony, height above the ground, unlimited diversity of food sources at any one time, and probably many other factors. It seems reasonable to suggest that the bees would be less stressed in tree colonies than on the ground.
Objectives: To test the hypothesis that exposure to tree habitats may expose bees to a greater diversity of symbiotic fungi compared to ground colonies, we determined the kinds and quantities of fungi present in bee bread. The beneficial nature of bee bread fungi was evaluated based on their ability to suppress growth of Ascosphaera apis (chalkbrood fungus) as a gauge of infection.
Results: More bee bread fungi were recovered from tree colonies than ground colonies (Table 1; P < 0.05). Figure 3 shows some representative culture plates. There was little to no fungi on the water-treated control plates (Table 1), indicating minimal contamination during the experimental manipulation of bee bread samples. Culturing on Sabouraud agar, another standard mycological growth medium, yielded nearly identical results as potato dextrose agar (Table 1). Similar numbers of fungal isolates were obtained from portions of the core of bee bread corresponding to the lower, middle, and upper third of the honeycomb cell (data not presented). This implies that the distribution of conidia is fairly uniform throughout the bee bread from top to bottom. There was no difference in bee bread fungus quantity between bee colonies from the same yard (P > 0.05; Table 1).
| Table 1. Fungus profile of bee bread from colonies of Apis meliffera. Number of isolated on potato dextrose agar (PDA), dilution factor = 10. An isolate is a portion of an individual fungus colony, thus only one kind of fungus (Fig. 3 A and C, a culture plate showing fungal colonies), that was subsequently subcultured and identified. | ||||||
|---|---|---|---|---|---|---|
| Tree colony | Ground colony | |||||
| Fungi | TH2 | TH3 | C126 | C175 | C207 | Water control |
| No. isolates (± SE ≤ 2.2) | 24 | 19 | 8 | 8 | 11 | 1 |
| % Composition (± SE ≤ 0.9) | ||||||
| Alternaria | 0 | 0 | 13 | 0 | 0 | 0 |
| Aspergillus | 8 | 0 | 0 | 25 | 18 | 0 |
| Aspergillus flavus | 8 | 0 | 0 | 0 | 0 | 0 |
| Aspergillus fumigatus | 0 | 11 | 13 | 0 | 0 | 0 |
| Aspergillus niger | 33 | 42 | 25 | 13 | 9 | 0 |
| Aureobasidium | 4 | 0 | 0 | 0 | 0 | 0 |
| Bipolaris | 4 | 0 | 0 | 0 | 9 | 0 |
| Cladosporium | 8 | 16 | 0 | 13 | 9 | 0 |
| Fusarium | 0 | 0 | 13 | 0 | 9 | 0 |
| Geotrichum | 4 | 0 | 0 | 13 | 0 | 0 |
| Mucor | 4 | 11 | 0 | 25 | 9 | 0 |
| Penicillium | 21 | 16 | 25 | 13 | 27 | 0 |
| Rhizopus | 0 | 0 | 13 | 0 | 0 | 0 |
| Scopulariopsis | 4 | 0 | 0 | 0 | 0 | 0 |
| Trichoderma | 0 | 5 | 0 | 0 | 9 | 100 |
| Simpson’s reciprocal index | 1.6 | 1.5 | 2.1 | 2.1 | 2.8 | – |
| SE | 0.03 | 0.03 | 0.07 | 0.09 | 0.06 | – |
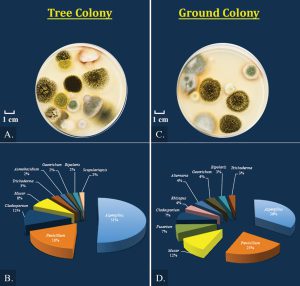
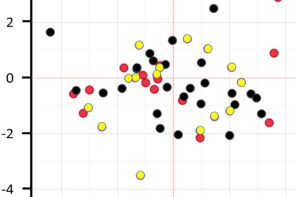
Figure 3. (A,C) Culture plates of bee bread fungi from tree colonies and ground colonies of Apis mellifera. (B,D) Corresponding mean percentage of fungal components from data in Table 1. Plates were chosen at random, neither selecting for best or worst examples. Conditions: potato dextrose agar, dilution factor = 10, two days incubation, 32°C, darkness. Blake Nelson photo.
Mean percentage of bee bread fungal components are in the pie chart (Fig. 3). The trend is that most of the fungi are Aspergillus, followed by Penicillium, then Cladosporium and Mucor, with several variable components being present in smaller amounts (P < 0.05; Table 1). Total Aspergillus was greater from tree colonies than ground colonies (P < 0.05; Table 1), with A. niger appearing most frequently from tree colonies (P < 0.05). This is not always true for the ground colonies, where sometimes a mixture of unidentified Aspergillus spp. dominates over A. niger (Table 1; P < 0.05). Amounts of Penicillium were consistent between tree and ground colonies (P > 0.05; Table 1). Ground and tree colonies had similar amounts of Cladosporium (P > 0.05), but amounts of Mucor varied (P < 0.05; Table 1). There was twice the Cladosporium, and nearly triple the Mucor, in tree colony TH3 compared to TH2 (P < 0.05; Table 1). Among ground colonies, C175 had two-times the Mucor as Cladosporium (P < 0.05), these two fungi were in similar amounts in C207 (P > 0.05), and neither of these fungi was recovered in C126 (Table 1).
Fungal diversity was greater for ground colonies compared to tree colonies (Simpson’s reciprocal index; P < 0.05; Table 1). Using data in Fig. 3, Simpson’s reciprocal index is 1.5 ± 0.08 for tree colonies (Fig. 3B) and this is lower than 2.6 ± 0.11 for ground colonies (Fig. 3D) (P < 0.05). One trend across all colonies is that as the percentage of Aspergillus increases, the Simpson’s reciprocal index decreases (y = -19.7x, R = 0.98). There are low correlations between Simpson’s reciprocal index with amounts of Penicillium (y = 6.5x, R = 0.33), Cladosporium (y = -3.4x, R = 0.08), and Mucor (y = -1.5x, R = 0.01). Thus, differences in diversity as reflected by the Simpson’s reciprocal index between tree versus ground colonies have more to do with the amount of Aspergillus. The high Simpson’s reciprocal index indicates that there is a greater probability that when selecting two fungi at random from the mixture that the two fungi will be different (Simpson, 1949). Mycoflora of tree colonies is less diverse (lower Simpson’s), because when selecting two fungi at random from the pool there is greater probability that both will be Aspergillus as a consequence of the Aspergillus fraction being so large (Fig. 3B and D).
When pitted against chalkbrood fungus A. apis in a culture plate, a total fungus inoculum of bee bread from tree colonies suppressed growth of A. apis by 48% (Table 2). Similarly, there was a 53% reduction in the growth of A. apis by a total fungus inoculum prepared from ground colonies even though it is less concentrated (P > 0.05; Table 2). One of the Penicillium isolates (sp. A) resulted in an approximate 40% reduction of A. apis growth, Penicillium isolate sp. B an approximate 20% reduction, and A. niger about a 24% reduction (Table 2). There was greater inhibition of A. apis growth by the total fungus inoculum than A. niger, Penicillium sp. A and B individually (P < 0.05 in each pairwise comparison; Table 2). Upon contact, fungi from the total inoculum (both tree and ground colony preparations), as well as A. niger, Penicillium sp. A and B, aggressively overgrew A. apis, resulting in no growth of A. apis (Kr = 0.00 mm/h; Table 2).
| Table 2. Growth inhibition of Ascosphaera apis by presence of a 1cm3 block of fungi. ‘Total’ is an inoculum that was prepared from all fungus colonies on a plate; ‘A. niger’ is an inoculum from all A. niger colonies; ‘Pen. sp. A’, and ‘Pen. sp. B’, are inocula from all Penicillium sp. A and B colonies, respectively. Kr, radial growth rate; NG, no growth, Kr = 0.00 mm/h. Data followed by the same superscript letter within a column are not significantly different (P < 0.05). | ||||
|---|---|---|---|---|
| Growth rate (mean Kr ± SE ≤ 0.011) of A. apis when: | ||||
| Bee colony | Blocks placed opposite each other: | Blocks placed on top of each other: | ||
| Competitor | Fungus vs. | A. apis | Fungus vs. | A. apis |
| Tree (≈ 2x more fungi than ground colonies) | Total fungi | 0.21 | Total fungi | NG(0.00a) |
| A. niger | 0.29b | A. niger | NG(0.00a) | |
| Pen. sp. A | 0.24c | Pen. sp. A | NG(0.00a) | |
| Pen. sp. B | 0.31b | Pen. sp. B | NG(0.00a) | |
| Ground | Total fungi | 0.18a | Total fungi | NG(0.00a) |
| A. niger | 0.25c | A. niger | NG(0.00a) | |
| Pen. sp. A | 0.27b | Pen. sp. A | NG(0.00a) | |
| Pen. sp. B | 0.27b | Pen. sp. B | NG(0.00a) | |
| Water control | Plain agar block | 0.38c | Plain agar block | 0.33b |
Conclusions: The most pronounced effect observed in this research was the capacity by bee bread fungi to completely dominate and overgrow an existing mycelium of A. apis, stopping its growth. Aspergillus niger is especially antagonistic toward A. apis as a secondary colonizer in this regard. There is also evidence for production of antifungal compounds as a form of chemical antagonism. For example, there is inhibitory action on the growth of A. apis before physical contact is made by bee bread fungi and its components, alone (A. niger, Penicillium sp. A and sp. B) and in combination (total fungus inoculum). The fact that the growth-inhibitory activity to individual fungal components (A. niger, Penicillium sp. A and B) is lower than that of the total fungus inoculum indicates that bee bread is a multicomponent system of beneficial fungi that protects against chalkbrood. This indicates that there are other fungal components in the bee bread that make its antifungal activity more potent.
None of the fungi that we recovered are unusual in bee colonies (Gilliam et al., 1988; Wood, 1998; Aronstein and Murray, 2010). Many healthy bee colonies feature Aspergillus as the dominant fungus group (Osintseva and Chekryga, 2008; Yoder et al., 2013; Foley et al., 2014). In the event of colony stress, the colony is at risk of opportunistic infection by these regular bee bread fungal inhabitants; i.e., chalkbrood by A. apis (Gilliam et al., 1988) and stonebrood by A. flavus, as well as A. niger, A. fumigatus and other Aspergillus spp. that can be associated with stonebrood disease (Foley et al., 2014 and references therein). From this study it is clear that healthy bees are capable of tolerating a high Aspergillus load in bee bread, and the bees can use Aspergillus to their advantage by exploitative competition against chalkbrood fungus, A. apis.
Larger amount of A. niger stands out for bee bread from tree colonies. Whether this is due to their placement in trees, differences in fungi abundance where bees forage, small size of the colony confining spores that circulate within the colony, and/or exposure to extra spores from decaying woody debris in the bio box are not known. Given the landscape of Christmas tree farms (tree colonies) and agriculture (ground colonies), it is interesting that kinds of bee bread fungi are rather consistent. These are mostly mitosporic (asexual) fungi and less zymgomycete (sexual) fungi, which could be a product of our culturing methods. Undoubtedly other kinds of fungi exist in bee bread that we did not detect. The Simpson’s reciprocal index approaching 1 for tree colonies simply points out that bee bread from tree colonies is essentially a single fungus community of Aspergillus. This is not the case for the bee bread mycoflora of ground colonies, where the higher Simpson’s reciprocal index is indicative of a more diverse fungus community that is not dominated by a single, large component. Colonies having low amounts of beneficial bee bread fungi typically show chalkbrood symptoms (Yoder et al., 2013). There is apparently no problem with the lesser amount of fungi associated with the bee bread of ground colonies, because these colonies are active, healthy, treatment-free colonies, with no sign of disease or failure. As healthy, thriving colonies, there is also no apparent problem of effective turnover of pollen into viable bee bread for proper development. Besides the large Aspergillus/Penicillium fraction, there are individual colony-to-colony differences whether the bees are using the same foraging habitat. This indicates that subtle variations in fungal composition can occur in spite of where colonies are set up.
This research on tree colonies is in early stages, and there is still a lot to learn. The coring technique we used is a convenient way to sample bee bread and stored pollen (subsequently bee bread) with plastic pipettes, pipette tips, or prepackaged, clean soda straws that can then be taken back to the laboratory, or sent off for fungus analysis. We conclude: (1) each bee colony location is different pertaining to the amounts and kinds of beneficial fungi in bee bread that are sustained by healthy bees; (2) the growth rate of an potential fungal pathogen A. apis does not continue to drop by addition of more beneficial fungi; and (3) every bee colony has a distinct fungus profile although coming from the same yard. This places a priority on regular monitoring of bee health in connection with bee bread fungus levels, events in foraging habitats (i.e., fungicide spraying), and behavior of the bees pertaining to what they are actually doing in the field at the individual colony level.
The take-home message for beekeepers is that what works best for bees in the trees is different from what works best for bees on the ground pertaining to amounts and kinds of bee bread fungi. We were able to definitively show the role of Aspergillus (particularly A. niger) as defensive against chalkbrood, and this was the largest fraction of fungi in bee bread from both tree and ground colonies in this region. We would have anticipated further lowering of growth rates of A. apis from more concentrated growth-inhibiting compounds with the higher amount of bee bread fungi in tree colonies, but this was not observed. Chemical antagonism against A. apis is not improved by more concentrated preparations of Aspergillus. We did notice that the more concentrated bee bread fungi from tree colonies were overwhelmingly more aggressive and grew over A. apis at a much faster rate than the less concentrated fungi prepared from ground colonies. This implies that bee bread from tree colonies is more effective at dispatching chalkbrood because of its greater beneficial fungi quantity.
Methods: Bee bread was collected by taking core samples from different honeycomb cells by inserting a disposable, sterile, polyethylene 1 cc pipette tip (Fisher Scientific, Pittsburgh, PA) directly into the bee bread. Each pipette tip containing bee bread was placed into separate 50 ml sterile polyethylene centrifuge tube (Fisher) and enclosed within a Whirl-Pak bag (Nasco, Salida, CA) for overnight shipping. For apiary records, the tree hive colonies that were sampled were TH2 (N = 5 samples collected), TH3 (N = 6 samples collected) and ground colonies were C126 (N = 8 samples collected), C175 (N = 8 samples collected) and C207 (N = 10 samples collected). Samples were collected during the day between 10:30-16:00 in late August 2014 and were analyzed by fungus culture within one to two days after collection.
The core sample was removed from the pipette tip with a sterile forceps and a scalpel, weighed to 10 mg (within ± SE ≤ 0.11 mg) with a microbalance (Cahn Ventron Instruments, Cerritos, CA, precision of SD ± 0.2 μg, accuracy of ± 6.0 μg accuracy at 1 mg), and placed into a sterile 1.5 ml microcentrifuge tube (Fisher). One milliliter of sterile, deionized, double-distilled (DI) water was added to the tube, then the sample was mixed with a vortex (Scientific Industries, Bohemia, NY), and diluted serially with DI water to 0.1, 0.01, 0.001. One milliliter and 0.1 ml of each dilution was plated on potato dextrose agar (PDA; Difco, Fisher) in a 100 x 15 mm Petri plate (Fisher) using a glass micropipette (accuracy ± 0.25%, precision CV < 0.6%; Fisher) as described for enumeration (Brown 2007). Plates were incubated in programmable incubators (< ± 0.5°C; Fisher) in darkness at 32 ± 1°C, the average temperature of the brood area within the colony environment (Cooper, 1980). Fungal colonies were counted with an automatic colony counter (Bantex Co., Burlingame, CA). A 1 cm3 agar block from the edge of a colony (= isolate) was removed with a sterile scalpel and placed onto a fresh plate of PDA for subculturing. Fungi from subcultures were identified using colony, conidia, and phialide characteristics by light microscopy at 1000x under oil (Barnett and Hunter, 1998) and pure culture comparison. Mycelia sterilia was used for sterile fungi that did not produce identifiable reproductive structures. A 0.1 ml DI water rinse of a pipette tip that contained no bee bread was analyzed as a control. Aseptic technique was followed throughout, using materials that were autoclave-sterilized or purchased sterile from the manufacturer. All of the work was done in a disinfected laminar flow hood (Cole-Parmer, Vernon Hills, IL). Each core sample of bee bread was analyzed in triplicate; i.e., three separate 10 mg portions from the same core sample. Fungus diversity was evaluated by the Simpson’s reciprocal index (Simpson, 1949); i.e., if there is only one species, then Simpson’s reciprocal index = 1, and the larger the number > 1, the greater the diversity.
To prepare a fungus inoculum, a five mm diameter agar plug was taken from the center of a fungus colony, mixed in five ml DI water with a vortex, and 1 ml of the fungus extract was spread over a PDA plate. After 10 days at 32°C, the fungus-covered plate was cut into 0.5cm3 blocks for testing. Similarly, 0.5cm3 blocks of chalkbrood fungus Ascosphaera apis were prepared from ground mummies (Johnson et al., 2005; Aronstein and Murray, 2010). The 0.5cm3 fungus blocks were placed onto the surface of non-nutritive agar (Fisher) containing crushed bee larvae as a mock infection, then incubated at 32°C. A 0.5cm3 block of agar containing no fungi served as a control. Radial growth rate (Kr) of A. apis was measured using the equation: Kr = (R1-R0)/(t1-t0), where R0 and R1 are colony radii at beginning of linear, t0, and stationary, t1, phases of growth (Baldrian and Gabriel, 2002) based on measurements of growth of the fungus mycelium as it spread over the agar surface. To test for production of antifungal compounds (primary resource capture), two blocks of fungi were placed on the agar plate: A. apis at one side versus test fungus on the opposite side. To test for the capacity of overgrowth (secondary resource capture), the block of A. apis was placed directly on top of a block of the test fungus.
Data (the mean ± SE of three replicates) were analyzed by an analysis of covariance (Duncan; ANCOVA, P = 0.05) using an arcsin transformation in the case of percentages (SPSS 14.0 for Windows, Microsoft Excel and Minitab; Chicago, IL; Sokal and Rohlf, 1995). A digital camera (Diagnostic Systems Laboratories, Webster, TX) and photoshop (Adobe Systems, San Jose, CA) were used to construct figures.
Authors:
Lynn Royce: Mitebee Farm Inc., 30807 SW Decker Ridge Rd., Corvallis, OR 97333 U.S. Department of Entomology, OR State University, Corvallis, OR 97331, U.S. retired (email: mitebee@peak.org)
Jay Yoder, Blake Nelson, Andre Lorenz: Department of Biology, Wittenberg University, Springfield, OH 45501, U.S. (email: jyoder@wittenberg.edu)
References
Aronstein K.A., Murray K.D. 2010. Chalkbrood in honey bees. J. Invert. Pathol. 103:S20-S29.
Baldrian P., Gabriel J. 2002. Intraspecific variability in growth response to cadmium of the wood-rotting fungus Piptoporus betulinus. Mycologia 94: 428-436.
Barnett H.L., Hunter B.B. 2003. Illustrated genera of imperfect fungi. 4th ed. APS Press. The American Phytopathological Society, St. Paul, MN.
Brown A.E. 2007. Benson’s microbiological applications: laboratory manual in general microbiology. McGraw-Hill, New York, NY.
Cooper B. 1980. Fluctuating broodnest temperature rhythm. Br. Isles Bee Breeders News 18: 12-16.
Foley K., Fazio G., Jensen A.B., Hughes W.O.H. 2014. The distribution of Aspergillus spp. opportunistic parasites in hives and their pathogenicity to honey bees. Vet. Microbiol. 169: 203-210.
Gilliam M., Taber III S., Lorenz B.J., Prest D.B. 1988. Factors affecting development of chalkbrood disease in colonies of honey bees, Apis mellifera, fed pollen contaminated with Ascosphaera apis. J. Invert. Pathol. 52: 314-325.
Johnson R.N., Zaman M.T., Decelle M.M., Siefel A.J., Tarpy D.R., Siegel E.C., Starks P.T. 2005. Multiple micro-organisms in chalkbrood mummies: evidence and implications. J. Apic. Res. 44: 29-32.
Morse R. 1984. Research review: How far will bees fly? Glean. Bee Cult. Sept.: 474.
Naug D. 2009. Nutritional stress due to habitat loss may explain recent honeybee colony collapses. Biol. Cons. 142: 2369-2372.
Osintseva L.A., Chekryga, G.P. 2008. Fungi of melliferous bees pollenload. Mikol. Fitopatol. 2: 464-469.
Simpson E.H. 1949. Measurement of diversity. Nature 163: 688.
Sokal R.R., Rohlf F.J. 1995. Biometry: the principles and practice of statistics in biological research. W.H. Freeman, San Francisco, CA.
Wood M. 1998. Microbes help bees battle chalkbrood. Agric. Res. 46: 16-17.
Yoder J.A., Jajack A.J., Rosselot A.E., Smith T.J., Yerke M.C., and Sammataro D. 2013. Fungicide contamination reduces beneficial fungi in bee bread based on an area-wide field study in honey bee, Apis mellifera, colonies. J. Toxicol. Environ. Health A. 76: 587-600.