


CO2, UV light, temperature and humidity all affect nectar production and quality
by Carmine DeStefano
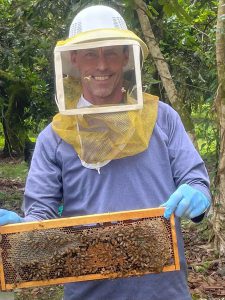
The practice and art of beekeeping is a tremendously rewarding experience that straddles natural history and ecosystem modeling activities. In the northeast part of the country beekeeping takes on several dimensions and the use of hive monitoring protocols is useful in understanding the health of bee colonies. Hive monitoring programs have exploded in recent years. For example, the Sentinel Hive project, the CSI monitoring project in the UK and Hivetool in North Carolina are some of these initiatives. These technology transfers give us important information, but relationships remain unexplored regarding the floral environment and a colony of honey bees. Expanding our knowledge base about these relationships can occur without implementing fancy and expensive equipment. Keen observation skills and phenological data tracking can tell us a lot about our world.

Many of the current monitoring programs are looking at weight changes and many internal factors that occur in the colony and this I think is useful information, but why stop there? The pre-eminent Eva Crane tells us that only about 16% of the plant life on the planet produces nectar and pollen resources that pollinators can exploit (Crane, 1990). But only about 1.6% is of keen interest to honeybees (Crane, 1990). This 1.6% of the floral environment produces the bulk of the world’s honey crop. Environmental monitoring that is referenced with honey yields is one way to understand and explore the impacts our environment has on the floral opportunities that bees find important.
Nectar concentrations are very sensitive to ambient conditions. Heavy rains for example can wash nectar from many plant flowers. High humidity can easily evaporate water from the sucrose nectar solution and change the concentration of the nectar making it less available to pollinators (Nicholson, 2007). High doses of UV light can disrupt the protein development in pollen granules. Elevated CO2 concentrations can change the general morphology of floral resources and also alter the concentration of particular amino acids in the nectar (Huang, 2010). Nectar and pollen resources are the fundamental building blocks for a healthy pollinator population, considering that pollinators are in decline worldwide looking more closely at the basic building blocks seems reasonable.
To illustrate how this complexity can shape pollinator syndromes lets look at two amino acids. Proline and Phenylalanine represent two amino acids that are of great importance to honey bee fitness. Proline is quickly metabolized by honey bees to produce accessible energy for flight and this amino acid can be more effective in producing short term energy burst than the normal glucose/ATP mechanism (Nicholson, 2007).
Phenylalanine is another amino acid and is ubiquitous in the bee-pollinated flora. We have known since Baker’s work in the 1970s that environmental factors influence proline, phenylalanine and many other attributes of nectar chemistry. These particular amino acids most likely hold a high level of importance to bees, considering that these two amino acids are constituents of the honey bee hemolymph.
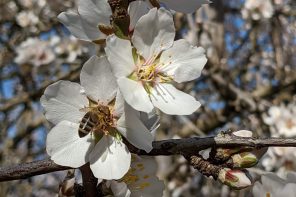
Floral environments are very complex places for bees to navigate. Flowers present nectar and pollen opportunities to pollinators at particular times during the flowers anthesis cycle. Anthesis cycles are greatly impacted by the ambient environment too. Sunny warm days support greater nectar secretions than dark cool days. For example, squash plants and almond flowers make their best nectar opportunities available early in their anthesis cycle, i.e., when the flower opens and is accessible for pollinators to exploit. Although the flower may be available and open all day on the trees or plant its nectar reward is highest for the first two or three hours after opening. The ambient conditions during this time affect the quality of that reward.
Many more research dollars should be allocated to study this topic further but in the meantime beekeepers have a wonderful opportunity to collect data so an educated conversation can begin about this topic.
I have started a very small program in the Northeast where I keep bees that is collecting hive weight and assembling satellite vegetation profiles of the hive location while collecting ambient temperature, humidity CO2 and UV data.
Nectar composition and concentration is a complex topic and understanding how the features of our ambient environment impact nectar and pollen is vital to our understanding of the plant pollinator relationship. The predominate factors that influence nectar/pollen development and quality is: CO2, UV-B light, water and temperature. These environmental factors effect among other things the development of plant nectaries, anther development and pollen generation in many plants.
Many experiments that were conducted in the 1970s looked at the impacts that climate variables had on various plant species. Many of these experiments showed that CO2, UV, temp and humidity affected the floral environment in ways that compromised the plant pollinator relationship. Expanding our monitoring envelope to include important floral development variables is an important first step in understanding the dynamic nature of honey bees in their environment.

MODIS Vegetation pixel.
I have designed a rudimentary protocol that beekeepers can implement in their apiaries that is cost effective and incredibility interesting. By setting one of your hives on a scale, this can be an electronic datalogger type of device or an old fashioned iron feed scale. Then taking weekly or daily weight measurements you can determine many qualities of your colony. Certainly swarms, forager dispatches, but one important feature in terms of this protocol is precise honey yield at the end of the season.
Next understanding the vegetation of the hive location is important in determining the presence of forage, satellite vegetation profiles generated by the MODIS instrument that flies aboard the Aqua and Landsat 7 satellites is a great tool for this. The following link allows you to put in your hives (lat/long) information and will generate a data product for you. This product can take a few days to receive and is good for about 30 days.
This satellite data is housed at the Oak Ridge National Laboratory DACC in Tennessee and is a free service.
You will need general CO2 data information and many options are available for this on the internet, however, the NOAA-ESRL site is a valuable resource for this.
Many places in the country have remote automated CO2 sites located on towers. This site information is a bit more cumbersome to work with so it is best to first determine if a remote CO2 tower exists near your, otherwise implementing the following site which is easier and has the Mauna Loa data which will work too. Both of these sites are free.
Keep in mind that CO2 data is usually collected weekly and if you do have a local tower near you that data can be delayed for up to two years for processing. Carbon dioxide data is also highly variable depending on your location and the weather of the day, so this is just baseline data that can later show correlations but is not fine enough to really rest a thesis on.
UV data can be found at TEMIS. Stations are located worldwide which makes this aspect of the data collection a bit easier, you can use the EPA SunWise site too. Just keep in mind the scales are slightly different so pick one service for the sake of consistency. Like CO2 data UV data is highly variable, cloud cover, elevation and the like all affect UV at the surface.

6.25 x 6.25 vegetation pixel and pixel key

Lastly, temperature and humidity data are easy to collect from your local weather service or regional airport. The closer the sensors are to your hive location the better of course.
By implementing this protocol and collecting weight, temp, humidity, UV and CO2 data research hive sites can generate a nice Excel spreadsheet. This data set can then be used and referenced for policies and scientific inquiry. Any beekeeper can participate and implement this protocol in their beekeeping activities. It provides a wonderful educational tool for understanding the complex dynamics and environmental feedbacks that honey bees reside in. Local bee clubs and university extension programs can utilize this protocol and develop their own databases. Additionally, this data can be shared or integrated into the larger monitoring programs that already exist.
The application of modern technology to monitor our world has grown exponentially. We have satellite technology that can monitor vegetation profiles and sensors placed over the globe that monitor CO2 and UV and a host of other variables. It would be nice if the beekeeping community began tracking these variables and correlated them to honey production.
This data will support a fundamental thesis of this project, that environmental variable such as: CO2, temperature, humidity and UV-B impact plant nectar and protein profiles. Compromised food sources contribute to honey bee mortality by supporting general nutritional duress for the bee population. Understanding how environmental parameters degrade or otherwise compromise the nutritional attributes of common bee forage has useful implications for the agricultural community and beekeepers alike.
To visualize the essence of this project think of a plot one meter squared. If you were to stand in the middle of this square and extend your arms your fingertips would be outside this hypothetical plot. Now, lets broadcast a variety of seed and wait. In our hypothetical plot let’s assume one thousand plants sprouted and grew to maturity. Of the one thousand plants only one-hundred-sixty if them will be entomophillic plants, or plants that are pollinated by insects. The remainder will be anemophilous, or wind pollinated plants such as grasses. Honey bees exhibit preferences when foraging, only 1.6% of nectar producing plants are of interest to honey bees as referenced by honey yield. Thus, our hypothetical meter squared plot of 1,000 plants contains 16 plants that honey bees rely on for most of their dietary needs; they will visit other plants because they are opportunist by nature but 16 plants they really prefer. Now if we were to enclose this plot and increase the temperature, humidity or CO2, what do you think the response would be? What if we changed UV light or any combination of these variables? Could we accomplish this without incident to the floral environment? Is it possible to change the variables without impacting those sixteen flowering plants? The literature on the matter indicates we cannot!
It seems easy to become bewildered in the honey bee decline debate but without some comprehensive data it is difficult to determine if pesticides, habitat loss or nutritional duress are to blame for this. Wonderful monitoring programs already are producing data and my hope here is not to further fragment the data horizon but to broaden its scope to capture data points that really influence the floral environment that bees are sensitive to.
Carmine DeStefano is a graduate student at Harvard Univ, an avid beekeeper of 10 hives located on the coast of ME and can be reached at carmine.destefano@gmail.com.
REFERENCES
Crane, E. 1990. Bees and Beekeeping Science, Practice and World Resources. Comstock Publishing Associates division of Cornell University Press
Nicholson, S., Nepi, M., Pacini, E. 2007. Nectaries and Nectar. Springer Publishing. Chapter 5 215-250
Huang, Z. 2010. Honey Bee Nutrition. Bee Culture Magazine/ CAP extension project www.beeccdcap.uga.edu/documents/caparticle10.html (retrieved May 2014)
Baker, H.G., Baker, I. 1977. Non- Sugar Chemical Constituents of Nectar. Springer Verlag Germany Apidologie pp.349-356