

Jessica Louque
Pollen Frenzy
Each year, we seem to have a honey bee field study that has a pollen collection aspect. This is my favorite part of the studies because itís used to identify that pollen the bees bring in. This is the end-all, be-all for the argument of what bees really eat. I suppose there could be the argument that some plants werenít found in the area, and that could be a valid statement. However, in general, I think the numbers speak for themselves.
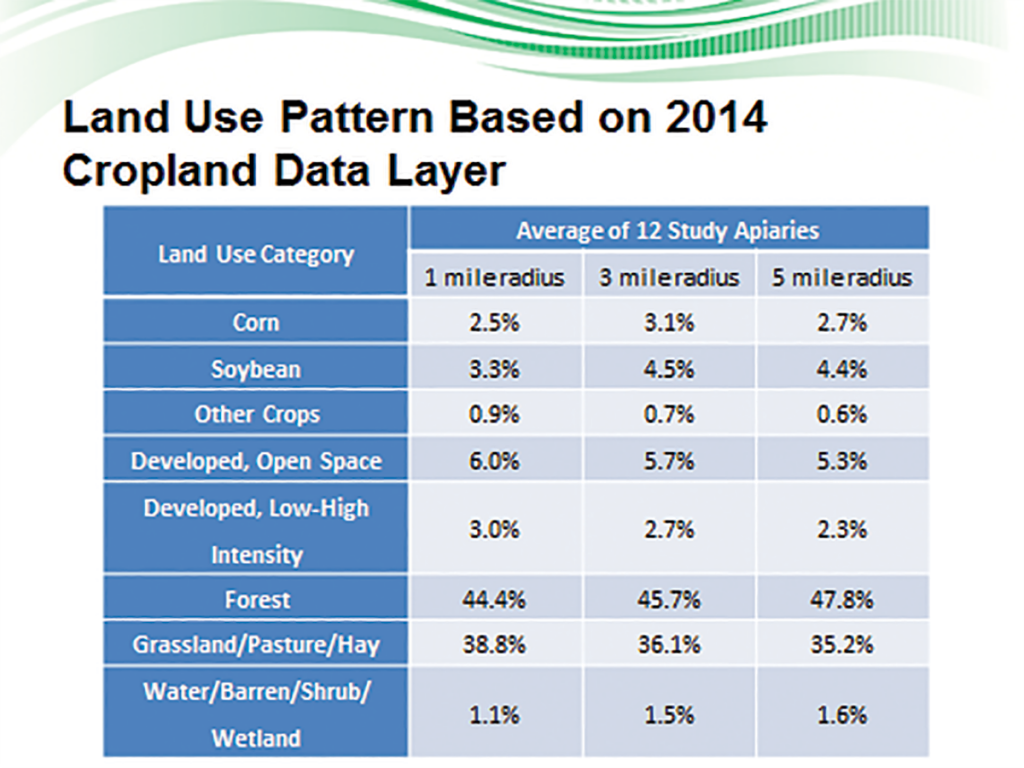
I only recently received the 2014 results, so I am about a year behind, and may be able to do a Part II after the 2015 results are in. Keep in mind that all of these hives that were used as collection points are in central NC, so I donít know how variable that will be to your home area.
The Background:
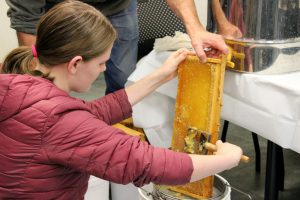
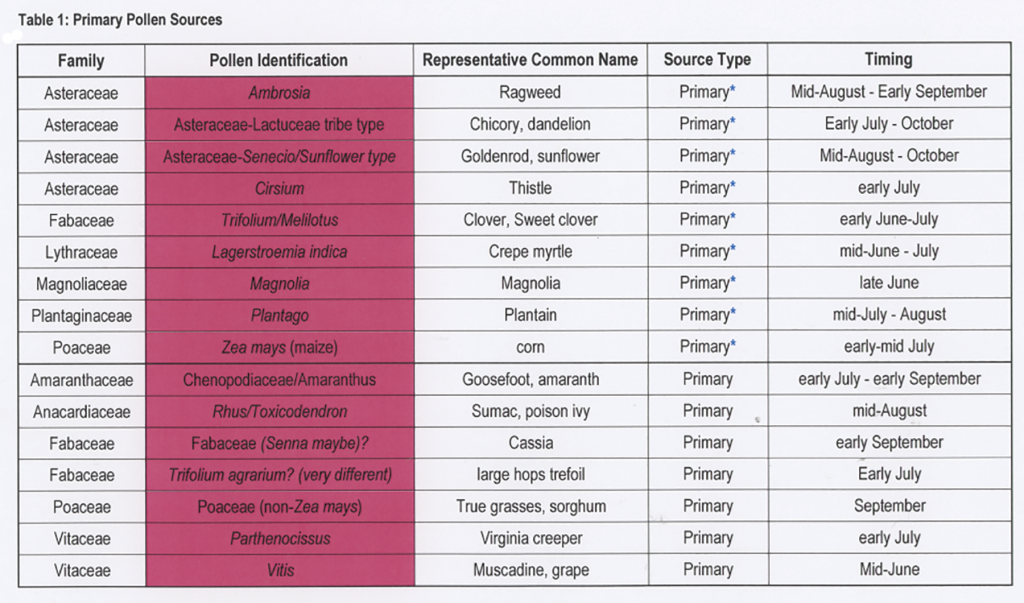
We had hives set out at 12 different sites, with one hive collecting pollen at each site over various time points from June until October. Sometimes, our hives did not collect any pollen, and sometimes they died in between samples. In total, we ended up with 51 pollen samples ranging from a tiny handful of baskets to over a pound of pollen. These samples were submitted to Dr. Sophie Warny at LSU and Dr. Vaughn Bryant at Texas A&M. They identified over 20,000 grains of pollen from these samples, with a minimum of 300 grains from each of the 51 samples. There were 40 pollen types recovered, with a few completely unknown types, and some that were multiples of the same family that couldn’t be identified farther, but were definitely related. Below, you’ll find the table where the major components that were identified are laid out. The “Pollen Identification” column indicates what was specifically identified from the pollen. The “Representative Common Name” column has a few of the local plants that are associated with what was identified for reference. You’ll also notice that some of the identifications are color coded. If an ID is marked with pink, it was found to be a predominant Primary source at least once during collection, with more than 45% of the pollen collected being identified to that plant. Green is a Secondary source, ranging from 16-44% of the pollen grains in any given sample. Yellow indicates a Tertiary source that is important, but only constitutes 3-15% of the total pollen collection. Samples that were not highlighted were only found in 1-2% quantities. If the “Source Type” column has Primary listed with a blue asterisk, then the source pollen appeared several times throughout the samples, even if it was the primary source only once.
Super Pollen:
Our main sources of pollen were from the Aster family, which were present in most of the samples. Chicory is an excellent pollen source for bees, and dandelions are one of the first weeds to be available to the bees during the year. This grouping had 17 hits that were considered Tertiary or above. Goldenrod and Sunflowers can run late into the year, and usually asters are the main source of forage for the fall. This pollen grouping had 18 hits that were considered Tertiary or above. The aster family was almost the entirety of all pollen found in the October samples and the September samples. Thistle was another heavy hitter in the pollen ID, but was only really found in early July. However, it was fairly widespread in abundance throughout the apiary locations, and still in the Aster family. Ragweed was one of our biggest contenders, with over 50% in five samples. In our mid-August to September samplings, the Ambrosia genus was the largest pollen source in most of the samples. Overall, the asters comprised a significant portion of not only the positive IDs, but of all the families identified.
Crepe Myrtle was an unexpected Primary source. It was the most abundant source found throughout the samples, ranging from minimal percentage to more than 80% of a sample. There were a total of 28 positive identifications of crepe myrtle found from the 51 samples, with four being primary sources and five being secondary sources. I personally did not expect this to be such a large constituent of their diet. Crepe Myrtles are providing a pollen source at a time of not a lot of other options, especially since June is either high desert or monsoon season in North Carolina (we don’t ever have “normal” weather here).
Magnolia was found throughout the samples in late June, which would be another one of the few sources available at that time of year. It was the lowest of what was found in multiple samples of high quantities, with only six hits that were a tertiary source or above. There were 14 total positive identifications of magnolia pollen, but most were 2% or less.
Plantain had the second highest count of any individual pollen source, with 24 positive identifications that were Tertiary or above, with five Primary sources and nine Secondary sources in the samples. In both June and July, plantain was the largest secondary source in most of the samples. The timing ran from the mid- July sampling throughout August. Plantain is normally considered a weed, but it’s also useful for insect bites and other itchy rashes to stop the itching (somewhat similar to the properties of jewelweed).
I don’t think anyone would be surprised by the addition of clover to the best pollen sources. The group had 17 findings throughout the samples that were Tertiary or above. This was another of the sustaining crops, not just for abundance but also for availability throughout multiple weeks. Clover was found all the way from early June into July. For the June samplings, clover was the highest percentage of all collected pollen.
Last but not least for the major continuous sources, we have corn. There were 15 significant identifications of corn that were Tertiary or above. In July, corn was one of the biggest contributors, with over 70% of the pollen originating from corn. This is differentiated from the Poaceae family in general, as other pollen was found that was noncorn but in the same family.
Primary Sources:
The Cheno/Am grouping from the Amaranth family was one of the largest sources of pollen for the mid-August sampling events. Also in mid-August, the Anacardiaceae family had a pretty large showing. This is the poison ivy/sumac family. Itís one of the easier pollens to sight- ID when you’re in the field because the pollen looks like the bees raided Cheeto dust from the bottom of a bag. This is normally the red-berried sumac in the area. We also have another high count in the bean/pea family in early September, but the identification was a little sketchy past the family. Another Trifolium/ clover was a Primary source, but the identification was not absolute on the type of clover. An odd one here is the grass/sorghum family. There is a lot of sorghum grown in the area, as there was a government subsidy offered to the growers in this region. I think a lot of the pollen originates from the sorghum, although we have a lot of hay fields that could potentially be a source. Virginia creeper is always a big pollen source in July in the south, no surprises there. A last odd one in this category is muscadine grapes. Normally, bees don’t play nice with grapes, but it was a Primary, Secondary, and Tertiary source for pollen in mid-June.
Secondary:
There were very few of plants that fell in this category. The first on the list was another Aster. The Marshelder was a decent pollen source in September, with a couple of insignificant contributions to a few other samples. Impatiens flowers were a Secondary source of pollen in September, and had a few Tertiary contributions in other samples. The last source on this list is buckwheat. Since we grow several acres of it in the area, it’s not surprising that it showed up as a mid-July pollen source.
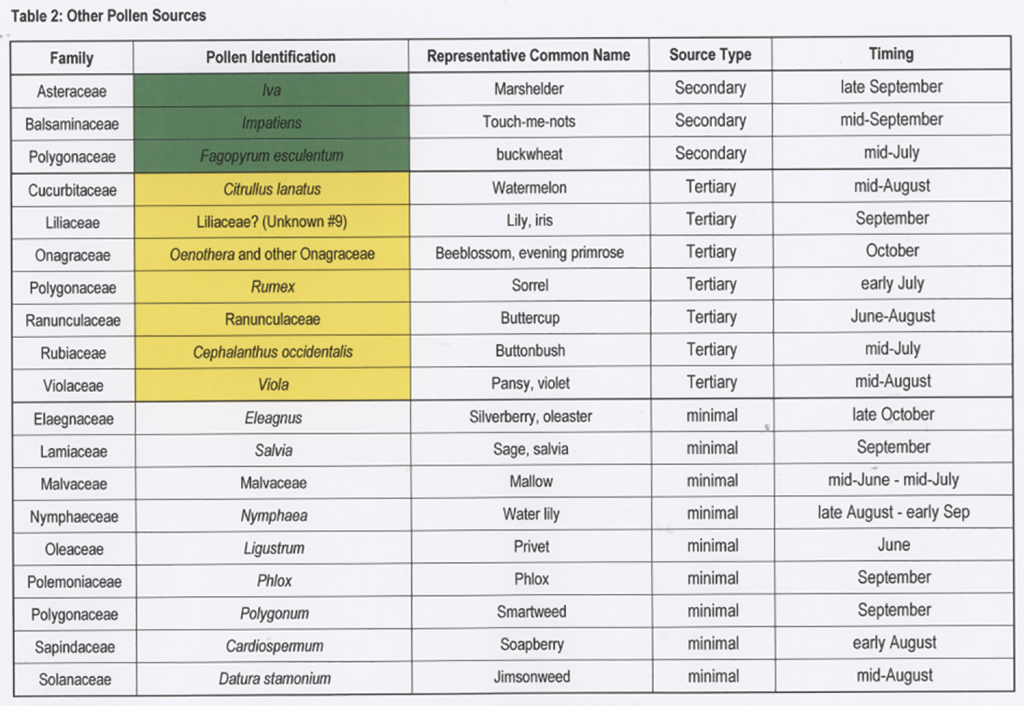
Tertiary:
Watermelons had one hit at 3% in mid-August, only in one sample. An unidentified member of the lily family offered 10% of one of the pollen samples in September. Beeblossom was present in one sample in October. There was one instance of Sorrel in an early July sample. Buttercups were a Tertiary component of one sample during June only, but showed up in minor quantities in other sampling dates. Buttonbush was only in one sample in mid-July. Pansies were only in one sample as well, in mid- August, but were 13% of the total sample.
Minor:
There were several other pollen sources that showed up in smaller percentages, but none of them were ever more than 2%. These help the diversity of the pollen nutrition, but donít seem to be preferred by the foragers. I hope this gives you a little insight into the mind of your bees. Coming up soon, we will have the results of 2015 and be able to compare the year-to-year pollen findings!